Map Information:
|
Map Title: |
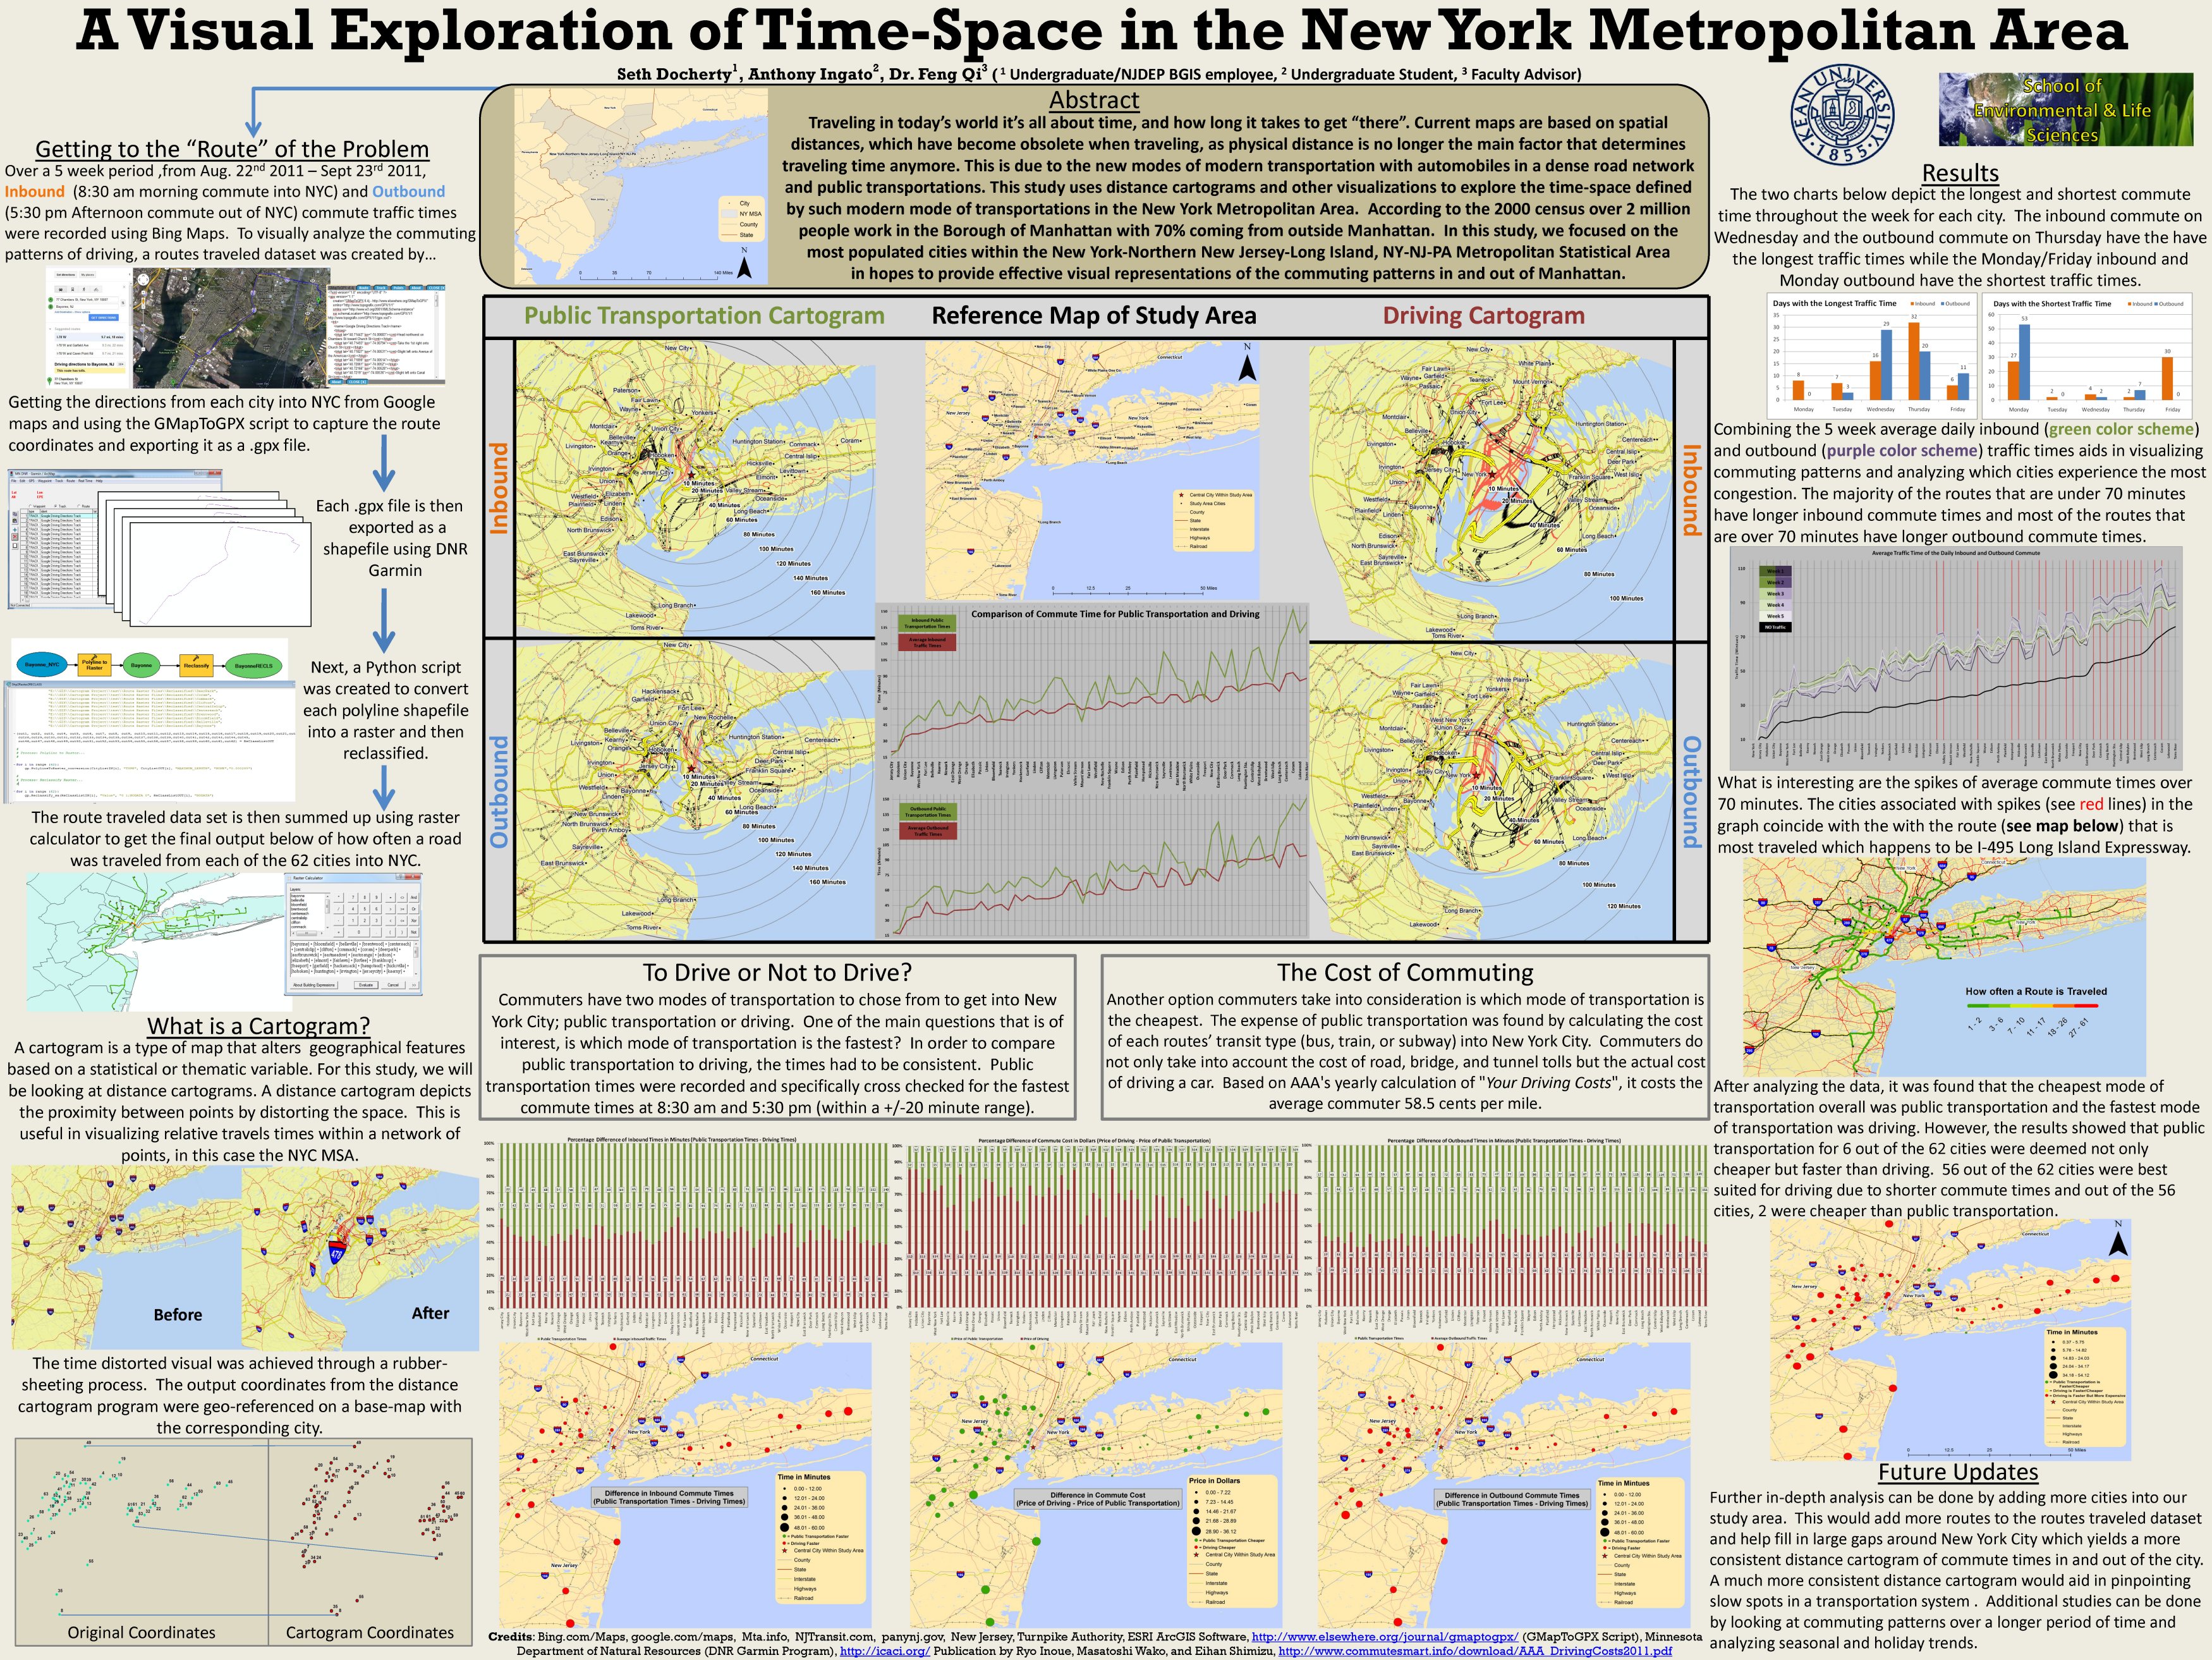
A Visual Exploration of Time-Space in the New York Metropolitan Area |
|
Name(s) of Author(s): |
Seth Docherty, Anthony Ingato |
|
Organization: |
Kean University |
|
Email Address: |
sddocherty@gmail.com |
|
Software Used to Make Map: |
ArcGIS 9.3.1 |
|
Data Sources: |
Bing.com, Google.com, Mta.info, NJTransit.com panynj.com, New Jersey Turnpike Authority, AAA |
|
Map Description: |
When traveling in today's world it's all about time, and how long it takes to get "there". Current maps are based on spatial distances, which have become obsolete when traveling, as physical distance is no longer the main factor that determines traveling time anymore. This is due to the new modes of modern transportation with automobiles in a dense road network and public transportations. The study was aimed at analyzing commuting patterns within the New York-Northern New Jersey-Long Island, NY-NJ-PA Metropolitan Statistical Area and three questions we were interested in answering were: |