Map Information:
|
Map Title: |
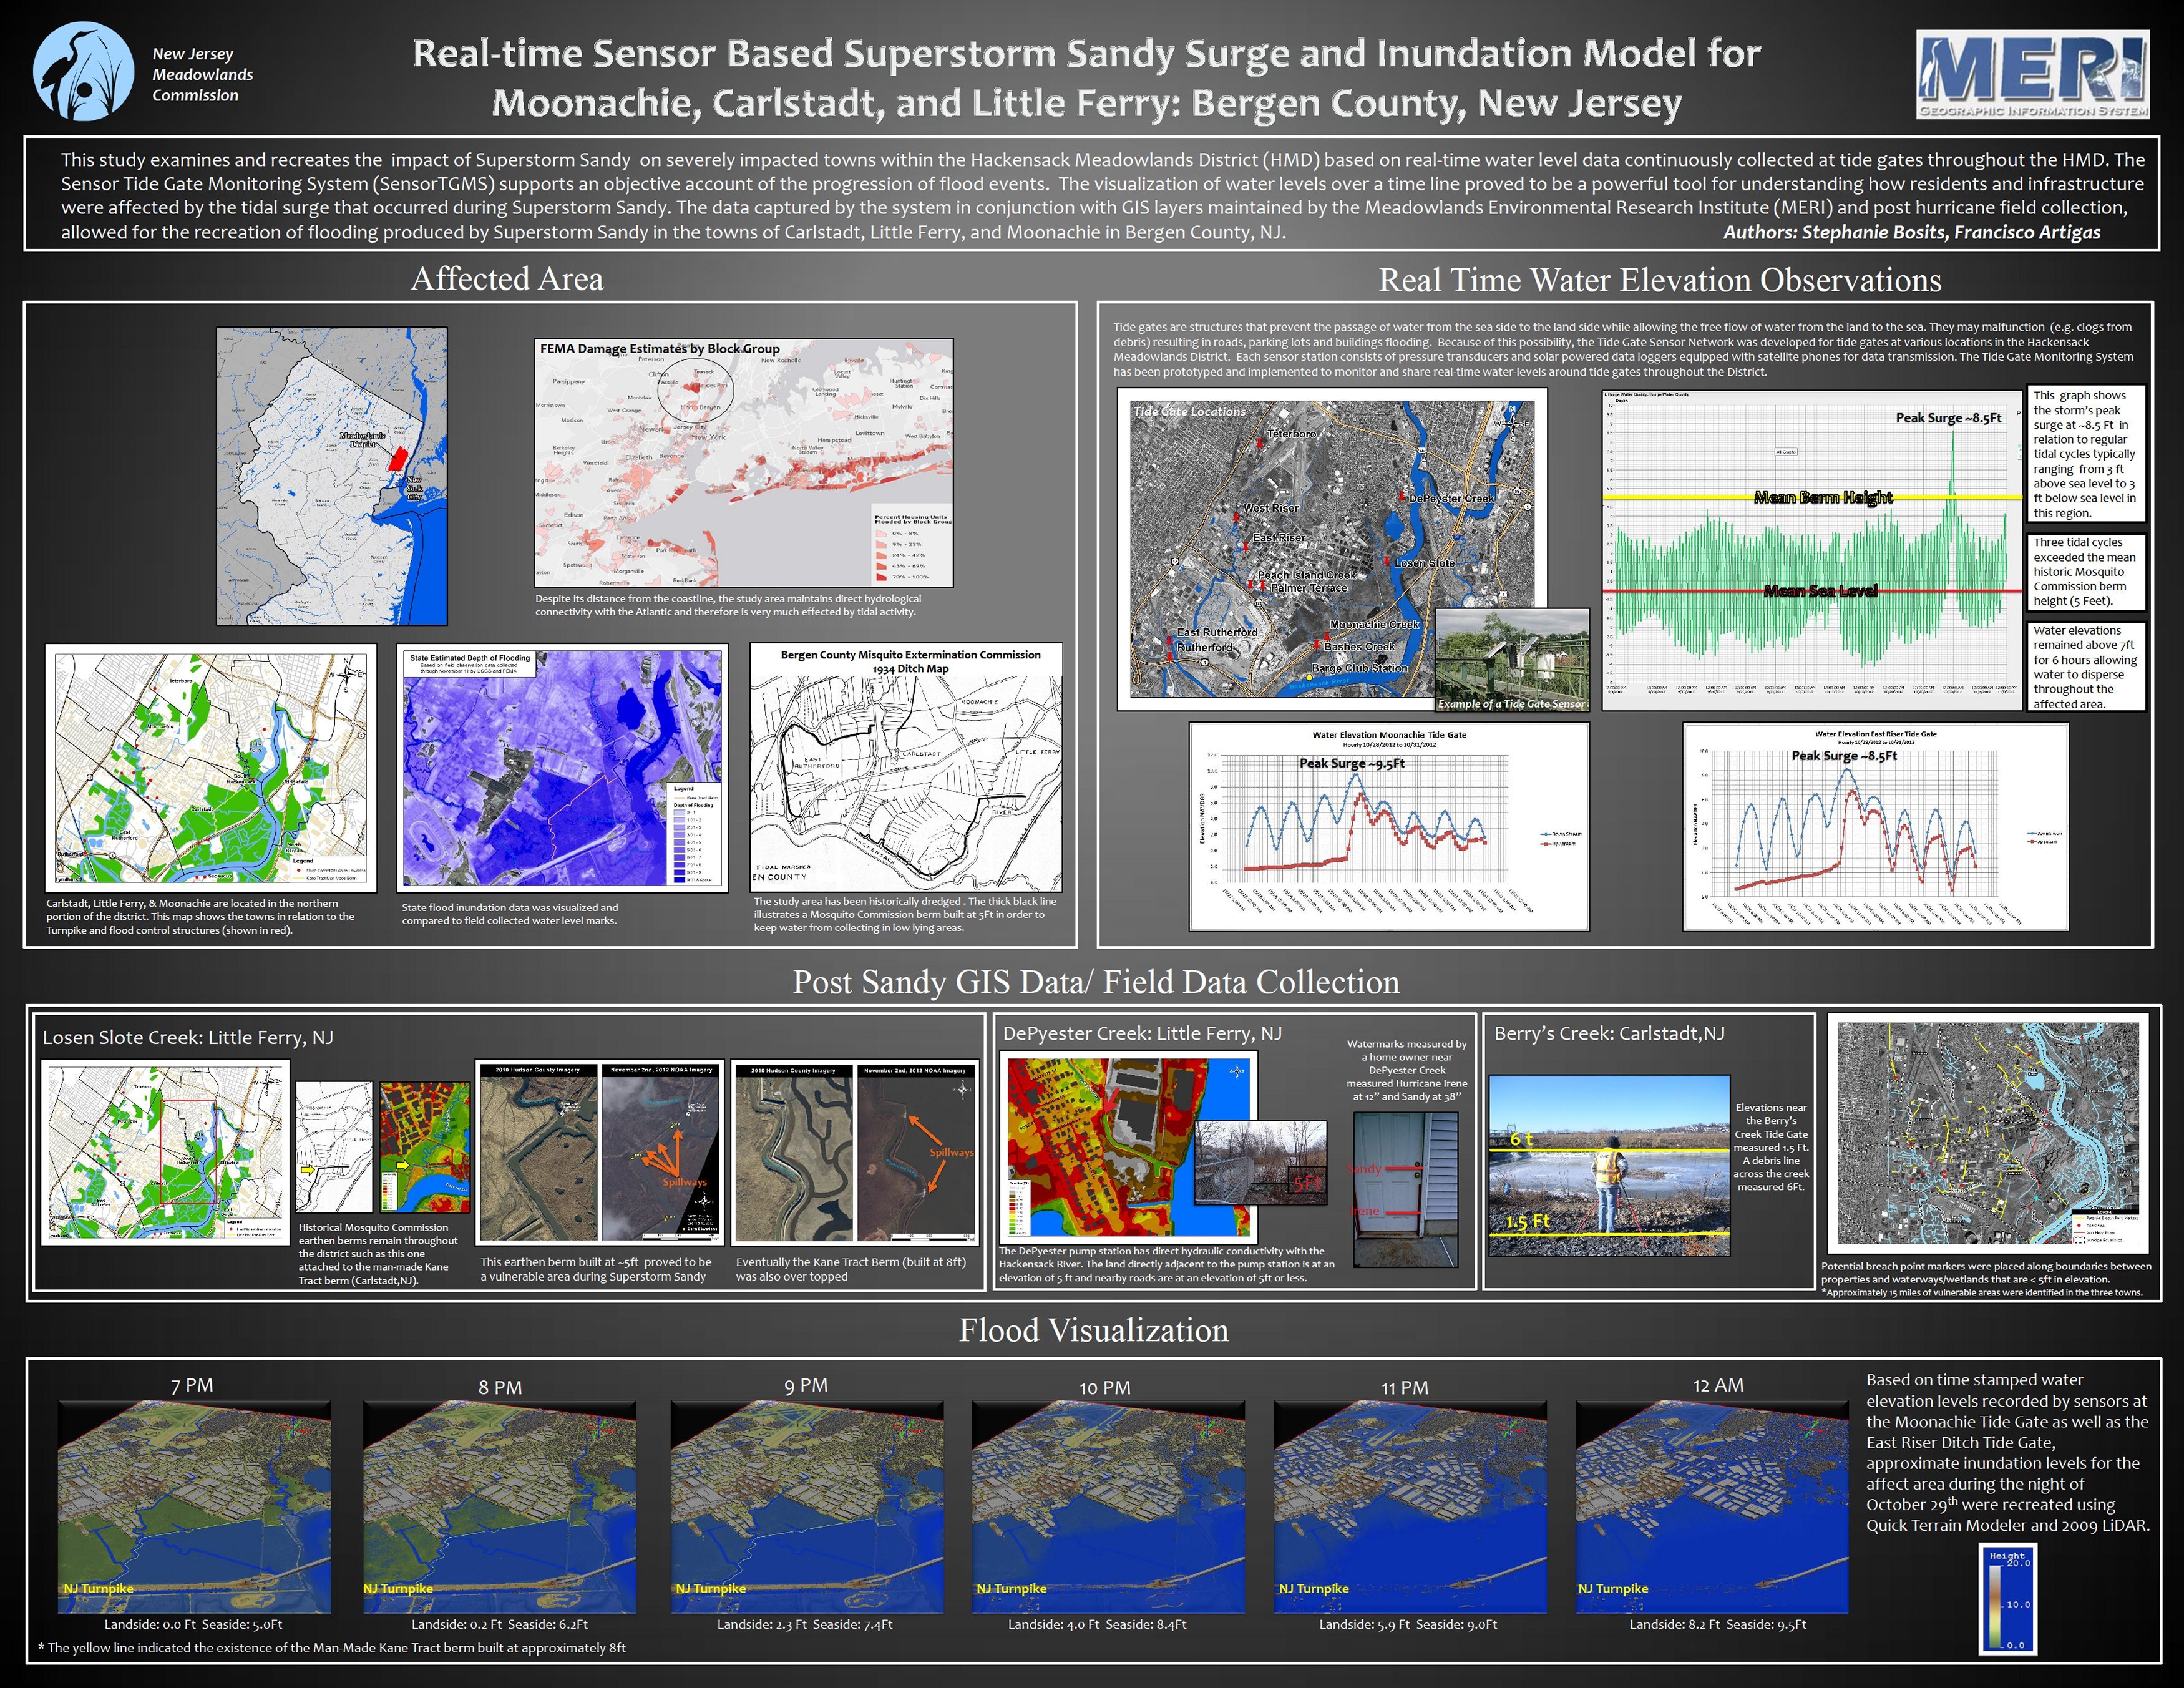
Real-time Sensor Based Super Storm Sandy Surge and Inundation Model
for Moonachie, Carlstadt, and Little Ferry Bergen County, New Jersey |
|
Name(s) of Author(s): |
Stephanie Bosits, Francisco Artigas |
|
Organization: |
New Jersey Meadowlands Commission Meadowlands Environmental Research Institute |
|
Email Address: |
Stephanie.Bosits@njmeadowlands.gov |
|
Software Used to Make Map: |
ArcGIS, Quick Terrain Modeler, Microsoft PowerPoint |
|
Data Sources: |
MERI GIS, FEMA |
|
Map Description: |
This poster outlines a study conducted by the New Jersey Meadowlands Commission (NJMC) Meadowlands Environmental Research Institute (MERI) examining and recreating the inundation of several towns within the Hackensack Meadowlands District (HMD) that were severely impacted by Superstorm Sandy. Despite the distance of these towns from the coast, they experience direct hydrologic conductivity with the Atlantic Ocean via the Hackensack River and a number of other tributaries. Much of this area is a low lying tidal basin that has been historically dredged by the New Jersey Mosquito Commission. This study allowed for a better understanding of the geography of the area as well as the creation of a flood inundation model. Real-time water elevation data collected throughout the storm allowed us to create a timeline of inundation and to pinpoint the height and time of the peak surge in several locations. This data in conjunction with GIS data layers maintained by MERI as well as post Sandy field collection of watermarks and precise elevation readings allowed for a deeper understanding of how the inundation occurred. |