By Brian Neilan
Assistant Biologist
January 29, 2015
INTRODUCTION - HISTORY OF FISHERIES SURVEYS
The Delaware Bay is New Jersey's largest estuary system. It is a semi-enclosed body of water on the south western coast of New Jersey where freshwater from the Delaware River mixes with saltwater from the Atlantic Ocean. It serves as spawning and feeding grounds, nursery areas, and migratory routes for many important recreational and commercial fish and invertebrates such as striped bass, weakfish, American shad, and blue crabs.
Bureau of Marine Fisheries biologists within the New Jersey DEP's Division of Fish & Wildlife conduct several yearly surveys to study and asses the status of important game and forage fish stocks within the estuary. One of these surveys is the Delaware Bay Juvenile Finfish Trawl Survey.
Began in 1991, The Delaware Bay Juvenile Finfish Trawl Survey was started in order to develop annual abundance indices for important recreational and commercial fish species. This survey was designed to mirror a similar study being conducted by the State of Delaware's Division of Fish and Wildlife along the western shore of Delaware Bay. Sampling stations were selected along the New Jersey coast of the bay in the shallow near shore waters preferred by many developing larval and juvenile fishes. The data collected from this survey is used by biologists to develop relative abundance indices and length frequency estimates of estuarine dependent finfish. These are important tools used by fisheries biologists to predict future stock trends and harvest potential for a variety of species.
Click on the links below for more Delaware Bay Finfish Trawl Survey information:
SURVEY LOCATIONS
EQUIPMENT/METHODOLOGY
CATCH HISTORY
WATER QUALITY
THE FUTURE OF DELAWARE BAY FISHERIES
|
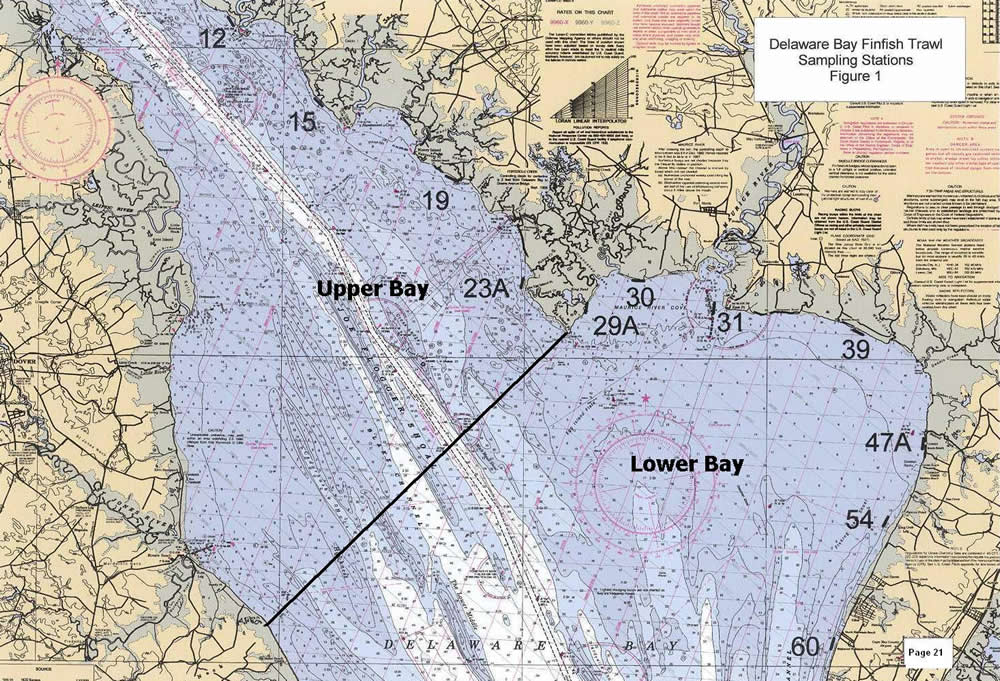
SURVEY LOCATIONS
The number of stations and their locations varied during the early years of the survey due to weather conditions and personnel constraints. Since 1997, 11 near-shore stations have been sampled once a month from the Cohansey River in the upper bay extending down to Villas in Cape May in the lower bay.
Sampling is performed over shallow shoals (depths generally ranging from 2-8 ft.) as this typically yields larger catches and greater species diversity than trawl tows in deeper water.
Return to top
|
|
|
EQUIPMENT/METHODOLOGY
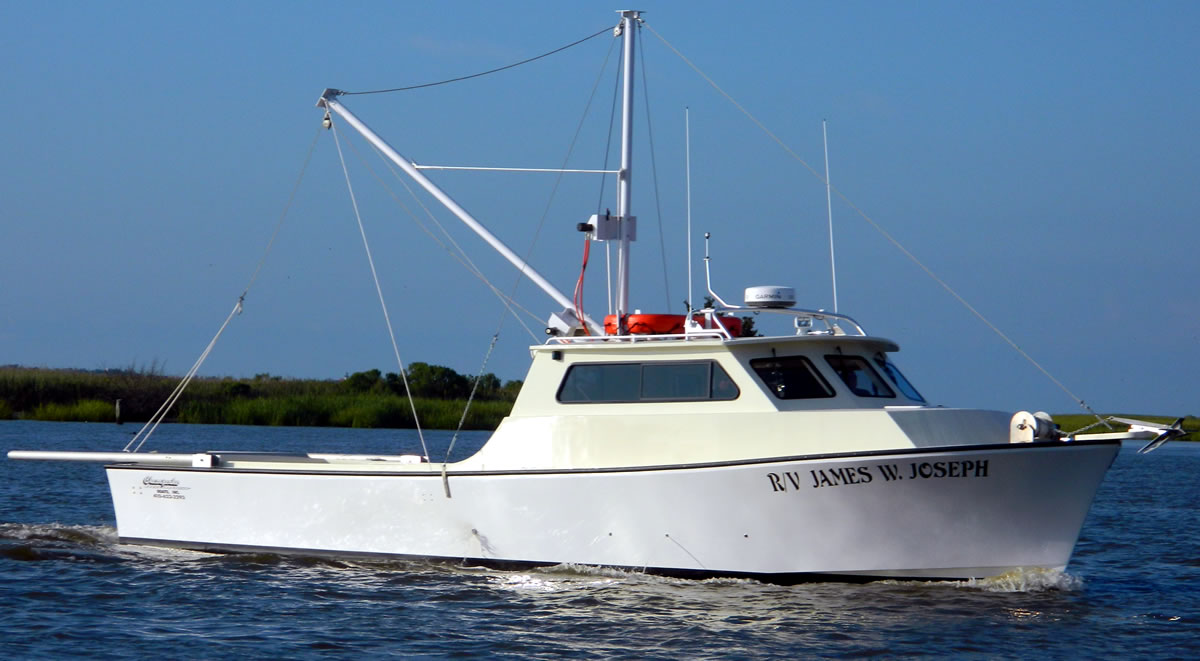
Sampling is performed once a month from April through October at each of the 11 stations within the bay for a yearly total of 77 trawl tows. A 16-foot otter trawl is towed for 10 minutes at each station behind the R/V James W. Joseph, a 46-foot research vessel operated by Division staff.
|
Click to enlarge
|
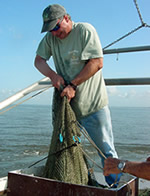
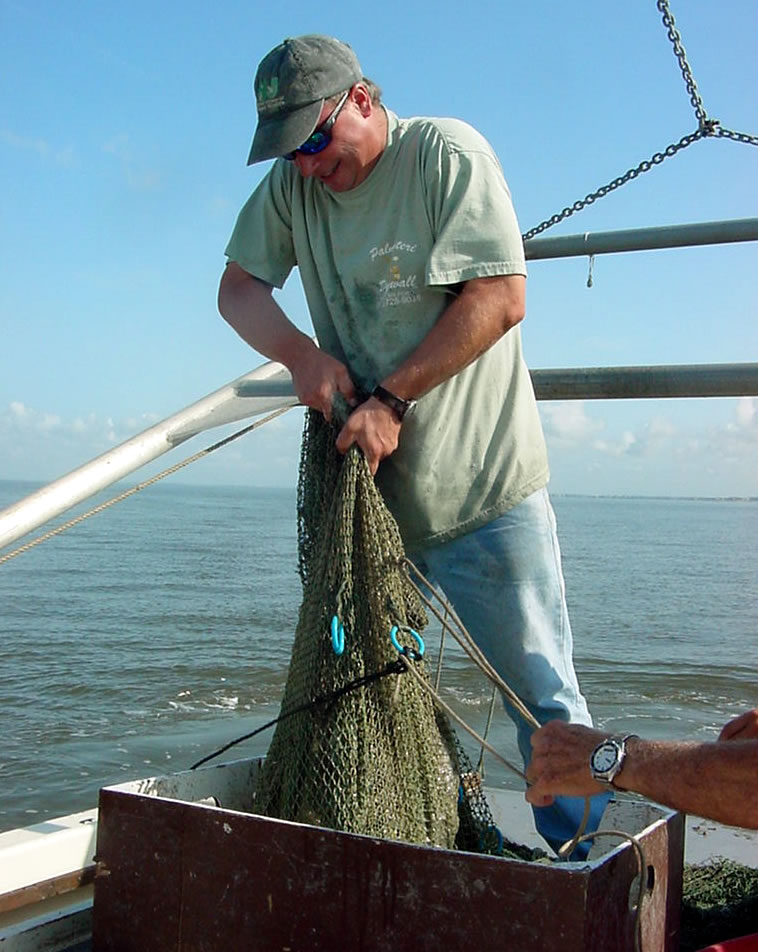
Emptying net for sorting
Click to enlarge
|
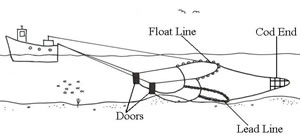
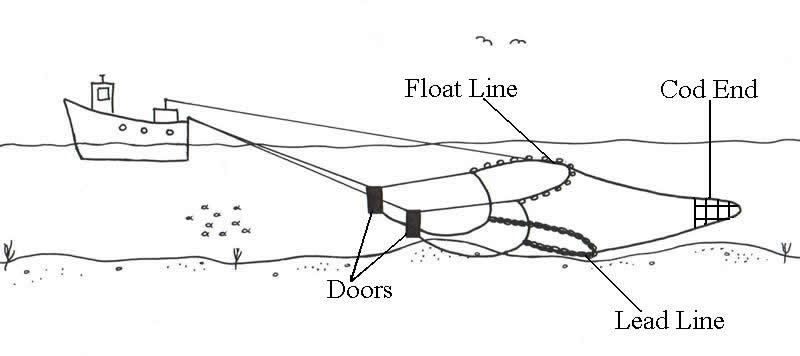
When underway, the otter trawl's "lead line" remains in contact with the bay-floor while the "float line" buoys the top of the net to keep it open vertically. Two wooden "doors" are attached to either side of the net's opening which act as spreaders to keep the net open horizontally while it is being towed. The rear-most section of the net called the "cod-end" is made of a small mesh where the fish are eventually collected and hauled on deck.
At the end of each 10-minute tow the net is retrieved by hand and the cod-end is emptied onto a sorting table. All of the fish and invertebrates are identified down to the species level, sorted, counted, and measured.
If a large number of any particular species is caught, a randomly selected subsample of 50 individuals is measured while the rest of the catch for that species is only counted. Lengths are measured in millimeters using fork lengths (tip of the nose to the inside fork of the tail) for species with forked tails (e.g. bay anchovy, bluefish) and total lengths for species without forked tails (e.g. summer flounder, Atlantic Croaker).
|
Return to top
CATCH HISTORY
|
To date, the Division has completed a total of 1782 tows, catching 432,593 fish resulting in an average of 243 fish per tow since the survey's beginning in 1991. A total of 89 species have been caught with the most abundant species being bay anchovy, Atlantic croaker, weakfish, blue crab, and Atlantic herring.
On occasion some unique species will show up on the sorting table that we do not typically see in New Jersey's marine waters. These fish tend to be species native to the warmer waters of the southeast coast and show up in our area in late August through September when water temperatures can be at their highest.
Some unique migrants caught over the years include lookdowns, Florida pompanos, skilletfish, yellowtail flounder, and a mutton snapper.
|
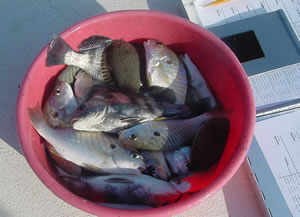
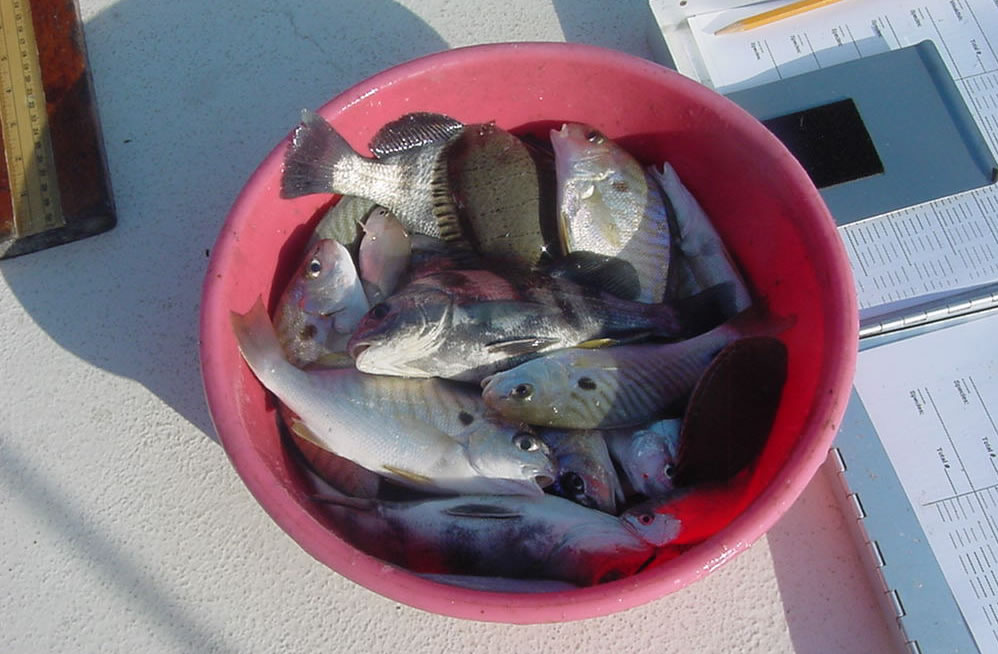
Unsorted catch of spot, black drum, and hogchokers
Click to enlarge
|
|
Summary table of all species caught (pdf, 17kb)
Click on the links below for species related data:
Bay Anchovy (pdf, 350kb)
Atlantic Croaker (pdf, 115kb)
Weakfish (pdf, 135kb)
Blue Crab (pdf, 120kb)
Atlantic Menhaden (pdf, 120kb)
Striped Bass (pdf, 130kb)
Unique Species (pdf, 97kb)
For more information about individual species (biology, range, etc),
please visit one of the following websites:
www.fishbase.org/
www.asmfc.org/
Return to top
WATER QUALITY INFORMATION
Water quality levels are recorded at each station at the end of the tow. These parameters are salinity (parts per thousand, ppt), water temperature (°C), and dissolved oxygen (milligrams per liter, mg/L). Measurements are recorded when a probe is lowered to the bottom of the water column using a YSI brand dissolved oxygen meter. The meter was not functional during the 2007 survey and this accounts for the gaps in data in the following graphs.
For this survey the bay is divided into upper and lower sections. The upper bay (north of Egg Island Point) has four stations within it and is characterized by lower salinity levels due to its further proximity to the ocean than the lower bay. The lower bay (south of Egg Island Point) consists of 7 stations and us characterized by higher salinity levels due to its close proximity to the ocean.
Salinity is the concentration of dissolved salts in a body of water. For the Delaware Bay Trawl Survey salinity is measured in parts per thousand (ppt) which is a measure of grams of salt dissolved per liter of water. Many different factors influence salinity including weather events, tides, and proximity to the ocean and freshwater inputs such as streams and rivers. Salinity values at a given location in an estuary such as the Delaware Bay can vary greatly from day to day due to these factors.
The lowest salinity ever recorded in the survey was at station 12 in 1994 which had a reading of 1.0 ppt. Station 12 is located the farthest from the ocean and is near the mouth of the Cohansey River, a significant freshwater input. The highest salinity ever recorded in the survey was in 2006 at station 60 with a reading of 30.7 ppt. Station 60 is the closest station to the ocean and lacks any nearby major sources of freshwater input. Overall salinity levels have remained fairly consistent since the beginning of the survey.
Salinity plays a major role in determining species diversity and distribution throughout the bay. While most species that utilize Delaware Bay have evolved to be able to tolerate the frequent salinity changes associated with estuarine systems, most have a preferred salinity range in which they can typically be associated with. Salinity preferences can change with the seasons and life history stages of a given species which is a major contributing factor to where and when we may catch them during a given trawl tow.
Salinity Graph
Water temperature is an important water quality parameter that influences spawning seasons as well as egg and larval development. It can be influenced by a variety of environmental factors including water depth, tides, and weather. The lowest water temperature recorded in the survey was at station 30 in 2009 with a reading of 8.2 °C (46.8 °F). The highest water temperature recorded in the survey was 31.0 °C (87.8 °F) at stations 39, 54, and 60 in 1993. Water temperatures have remained fairly consistent over the years since the beginning of the survey.
Water
Temperature Graph
Dissolved oxygen (DO) is a measure of the amount of gaseous oxygen that is dissolved in a body of water. For the Delaware Bay Trawl Survey it is measured in milligrams per liter (mg/L). Oxygen diffuses into the water from the atmosphere at a rate that is influenced by tides, run-off, wind, temperature, and storms. Adequate oxygen levels are essential to fish health at all life history stages with most species becoming severely stressed when levels dip below 2.0 mg/L. The lowest recorded DO level was 2.08 mg/L at station 47A in 2014. The highest recorded DO level was also recorded at station 47A in 1994 with a reading of 12.8 mg/L. Overall DO levels have remained fairly consistent since the start of the survey.
Dissolved Oxygen Graph
Return to top
THE FUTURE OF DELAWARE BAY FISHERIES
Surveys like the Delaware Bay Juvenile Finfish Trawl are the groundwork for the overall stock assessment process. The data gained from such fisheries surveys can be used at a state level to assess local fish stocks or combined with data from other states to in an effort to better understand coastwide population trends and harvest potential.
Data collected from this trawl survey as well as similar surveys from other states have reflected an increase in striped bass numbers along the entire east coast. Conversely, a decrease in bay anchovy numbers, an important forage fish for predators, has been demonstrated over the course of the survey.
As with any ecosystem, data collected from the Delaware Bay estuary have shown fluctuations among most of the species that have been caught. Large estuaries such as the Delaware Bay are dynamic systems in which a myriad of physical, chemical, and biological factors can influence fish populations. These natural factors along with recreational and commercial fishing and harvesting influence these fluctuations. It is the job of the fisheries biologist to interpret these trends and fluctuations in order to manage fisheries to prevent overharvesting. This is one way to ensure that subsequent years experience sustainable fisheries, healthy ecosystems, and robust natural populations.
Return to top
Information for this article was provided by Assistant Biologist Brian Neilan, lead investigator, and Principal Biologists Jason Hearon and Jeff Normant, co-investigators, as well as Senior Biologist Jennifer Pyle. Funding for this survey is supported by the Sport Fish Restoration Program administered by the U.S. Fish & Wildlife Service.
Return to top
