| New Jersey Division of Fish and Wildlife |
|
| June 30, 2002 | Back/Next | ||||||||||||||
|
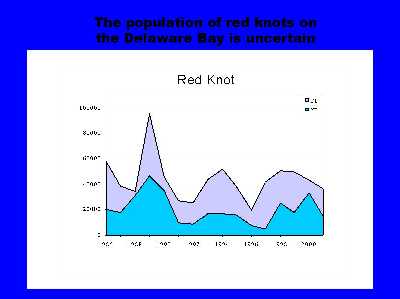
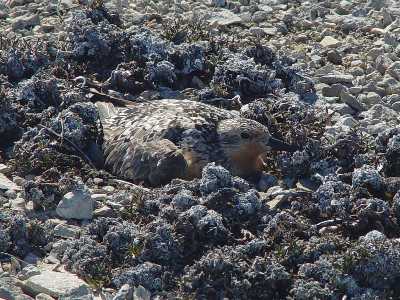
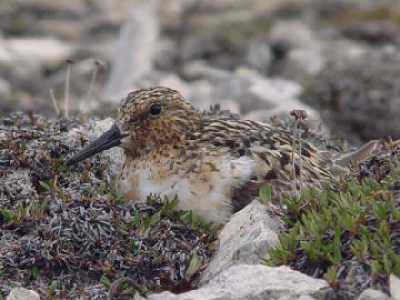
I can't imagine the sun shines more brightly anywhere else in the world than it does on a clear day on the tundra. With no wind and no clouds the sun warmed us until we were compelled to work in short sleeve shirts. Although our spiritual beliefs ranged widely, we were all thankful to the same spirit on that warm day. In contrast to the day of the 50 mph winds, we felt like we had taken a trip to the Caribbean. Our luck with the birds took the opposite twist. We had delayed instrumenting, banding and measuring the nesting knots so we could complete all the surveys. We also wanted to give the birds time to settle into their sites because we knew one female knot had yet to complete its clutch. On the day when the sun shone brightly, we prepared to begin a new phase of our study, the telemetric study of movements, habitat use, and nesting behavior. We had hoped to duplicate the work completed two years ago when we had instrumented six birds. Mark led the group to the first site only to find the nest depredated and the nesting pair nowhere in sight. We stared silently at a nest cup emptied of all contents probably by a fox, possibly a jaeger. Then we walked quickly to the second nest, the one still completing its clutch, where we found it depredated as well. Finally we went to the third nest, the nest where Bruce and Mark saw a bird in an empty cup that we hoped was the beginning of a clutch. The cup remained empty, and one of the pair appeared to be mocking us on that grim day. All data illuminates and the predation of that day created some understanding of the changes we were witnessing on the Delaware Bay. The story begins with the survey of shorebirds on the bay completed by Kathy Clark. On the attached graph, one can see a clear (and statistically significant) cycle in the numbers of red knots. Generally, the birds' numbers rise for two years then decline for two years. This regular fluctuation in numbers has taken place since 1986. At first, it appeared to us that there was a variation in the count caused by peculiarities in the survey method. Kathy counts once a week for the six weeks of the survey, which leaves open numerous possibilities for error. However, she has done the count, with Jimmy Dowdell, for the entire period using the exact same method creating a consistency unmatched in most long-term surveys. So why do knots cycle? Cycling, in other species like lemming, ptarmigan, and further south of us lynx and snowshoe hare, is well known. In our study site, we have seen the complete cycle of lemmings. Two years ago we observed them scurrying amongst the rocks, and this year, they have virtually disappeared from the landscape. After decades of debate, the cause of cycling is still a matter of ecological debate. Regardless of cause, we have seen a concurrent predator response here in our study site. Jaegers, snowy owls and arctic foxes all appeared to have peaked last year, one year after the peak in lemmings. Now that the lemmings are at a low this year what do all those predators eat? Perhaps, they are eating the eggs of shorebirds, including the red knot's. But why do red knot numbers appear to cycle according to the Delaware Bay data while the sanderling and ruddy turnstone numbers don't? Perhaps part of the answer lies in the distribution of red knots. According to our original search for transmitters on knots we found that the main concentration of knots in our flyway may be in only two places, Southampton Island and King William Island leaving them most affected by the cyclic changes in predators. Sanderlings and turnstones are widely distributed throughout the Arctic leaving them subject to all phases of predator abundance each year. We now know that predation is an important part of a knot's life. |
|