Table of Contents
Introduction
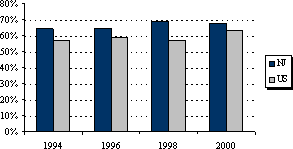
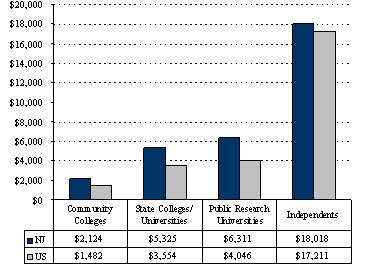
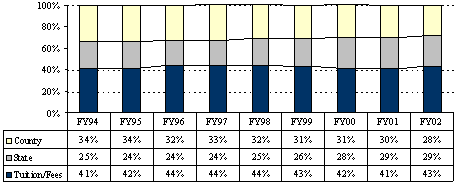
Capacity - The Baby Boom Echoes Across New Jersey
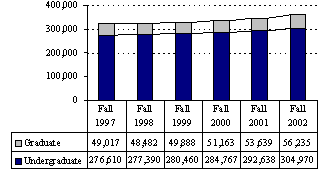
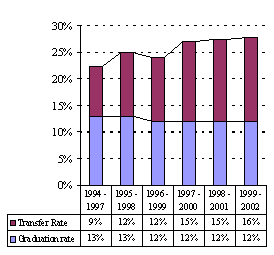
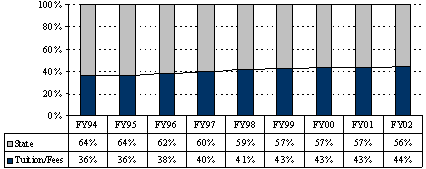
Costs - Affordability
Student Financial Assistance
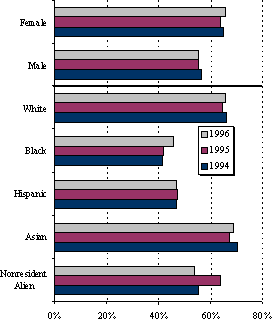
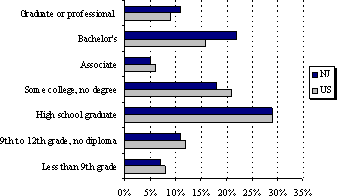
From Admission to Graduation
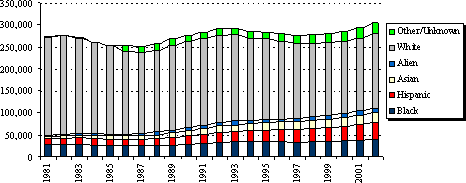
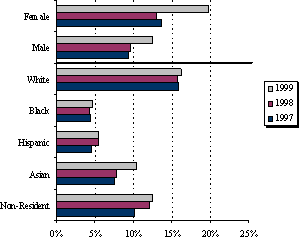
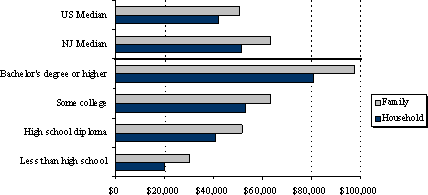
Completions - Baccalaureate Degree-Granting Institutions
Completions - Associate Degree-Granting Institutions
Resources -
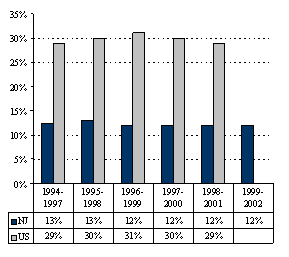
The Faculty
Resources
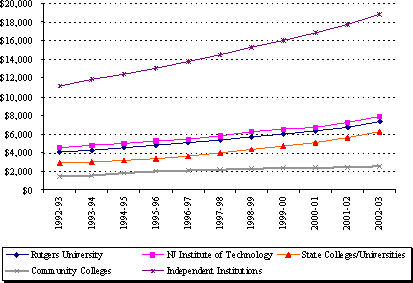
- State Support
Resources
-Who Pays?
Benefits
Key Findings
|
Accountability stands as a major state higher education policy issue in New Jersey. In the increasingly knowledge-driven global economy, higher education accountability represents a mechanism for providing consumer information and performance-related data to the public. The statewide focus on accountability arises from perennial concerns about access for New Jersey residents who want to attend college, the increasing difficulty of paying for college, and an incomplete understanding by the public about what quality in higher education means. In New Jersey, the Commission on Higher Education together with the colleges and universities are accountable to students, taxpayers, businesses, communities, and state and local leaders. The New Jersey Commission on Higher Education is responsible for statewide planning, coordination, and advocacy for higher learning in our state. In conjunction with these responsibilities, the Commission publishes an annual systemwide accountability report on higher education in New Jersey designed to identify priorities and inspire dialogue for future change and growth. In addition, the Commission is involved in developing a long-range plan for higher education in New Jersey. Successful implementation of this plan depends on a strong compact between the state and its diverse institutions of higher learning. In future years, systemwide accountability reporting will measure how well realization of the plan fulfills the higher education needs of students and effectively addresses state priorities. This year’s systemwide accountability report follows an established practice of assessing annual progress based on student-centered outcomes or results. It is a statewide performance report, reflecting what students get out of higher education, as well as what resources the state and others put into it. Among its principal findings are these:
|