Breast cancer screening
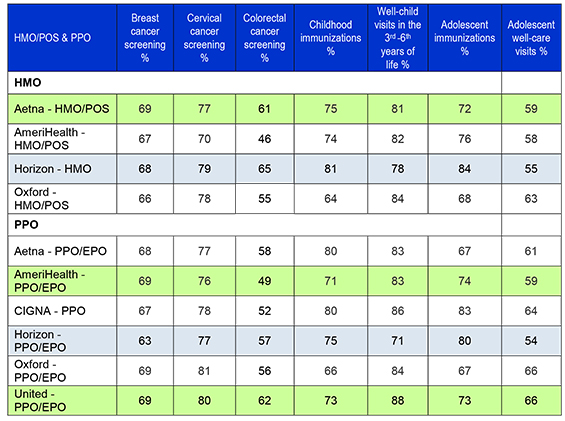
Mammograms are recommended for detection of breast cancer. The bar graphs show the percentage of women aged 42–69 who received a mammogram within the past two years.
A higher percentage rate is better for the breast cancer screening measure. It shows that more women got a mammogram within the measurement year.
|
| HMO |
|
PPO |
 |
|
 |
| |
|
|
Cervical cancer screening
Pap smears are recommended for detection of cervical cancer. The bar graphs show the percentage of women aged 21–64 who received a Pap test within the past three years.
A higher percentage rate is better for the cervical cancer screening measure. It shows that more women got a Pap test within a given timeframe.
|
| HMO |
|
PPO |
|
|
 |
| |
Colorectal cancer screening
Colonoscopy is recommended to look for early signs of colorectal cancer. The bar graphs show the percentage of members aged 50-75 who had appropriate screening for colorectal cancer.
A higher percentage rate is better for the colorectal cancer screen measure. It shows that more adults in the 50-75 age group were screened for colorectal cancer.
|
| HMO |
|
PPO |
|
|
|
| |
|
|
Childhood immunizations
Immunizations prevent childhood diseases
such as polio, measles, mumps, rubella and
whooping cough. The bar graphs show the percentage of children who received
recommended immunizations by age two.
A higher percentage rate is better for the childhood immunization status. A higher percentage shows that more children received all of the required immunizations.
|
| HMO |
|
PPO |
|
|
|
| |
|
|
Well-child visits in the third, fourth, fifth and sixth years of life
The percentage of children 3-6 years of age who had one or more well-child visits with a primary care provider (PCP) during the measurement year 2015.
For this measure, a higher percentage rate is better, which means that more young children had one or more well-child visits to a primary care physician and that fewer young children had zero visits. |
| HMO |
|
PPO |
|
|
|
| |
| |
Adolescent immunizations
Adolescent immunizations prevent adolescent diseases
such as meningococcal, tetanus, diphtheria toxoids and acellular pertussis. The bar graphs show the percentage of adolescent children who received recommended immunizations by age 13 in the measurement year 2015.
A higher percentage rate is better for the adolescent immunization status. A higher percentage shows that more adolescent children who turned 13 years of age during the measurement year had received all of their required immunizations.
|
|
|
|
| |
Adolescent well-care visits
The bar graphs show the percentage of members 12-21 years of age who had at least one comprehensive well-care visit with a primary care provider (PCP) or an obstetrician/gynecologist (OB/GYN) practitioner during the measurement year 2015.
A higher percentage rate is better for this measure. A higher percentage shows that more adolescents and young adults have one or more well-care visits to a PCP or an OB/GYN.
|
|
|
|