 Official Site of The State of New Jersey
Equity Impact Methodology
With the recently passed Bipartisan Infrastructure Law (BIL) legislation NJ has an extraordinary opportunity to reimagine and transform its aging infrastructure and address longstanding inequities experienced by diverse underserved communities throughout the state. By building a data resource to track formula funding allocations for BIL, NJ will be able to monitor, measure and maximize the impact and success of the many BIL programs on the state’s equity goals.
Introduction
The NJ BIL/Infrastructure Investment and Job’s Act (IIJA) dashboard’s equity analysis keeps users up to date on the state’s progress in the deployment of infrastructure funds to project implementation and the potential of those deployments to target benefits to disadvantaged communities and overburdened communities.
As part of the Administration's ongoing work to bridge opportunity gaps and ensure equitable outcomes, the Office of The Governor recognized the importance of performing this equity analysis and developed an Equity dashboard that is meant to see how investments from the Infrastructure Investment Jobs Act are targeted in historically underserved and overburdened communities. Users can view project locations that experience environmental, health and socioeconomic burdens from historic disinvestment in communities across New Jersey and identify where federal resources are being directed to address longstanding harm from this underfunding.
Acronyms
| BIL | Bipartisan Infrastructure Law |
| CDC | Centers for Disease Control and Prevention |
| CEJST | Climate and Economic Justice Screening Tool |
| CEQ | Council on Environmental Quality |
| DAC | Disadvantaged Community |
| OBC | Overburdened Community |
| SVI | Social Vulnerability Index |
Analysis Methods
The equity analysis of the projects included in NJ BIL/IIJA Dashboard is designed to 1) illustrate where funded projects are being implemented in and benefit underserved communities and determined by CEJST and NJ Department of Environmental Protection Environmental Justice Mapping, Assessment and Protection Tool (EJMAP) and 2) categorize projects receiving infrastructure formula funds according to the investment category that corresponds to the Climate and Economic Justice Screening Tool (CEJST) categories of burden which include climate change, energy, health, housing, legacy pollution, transportation, water and wastewater, and workforce development.
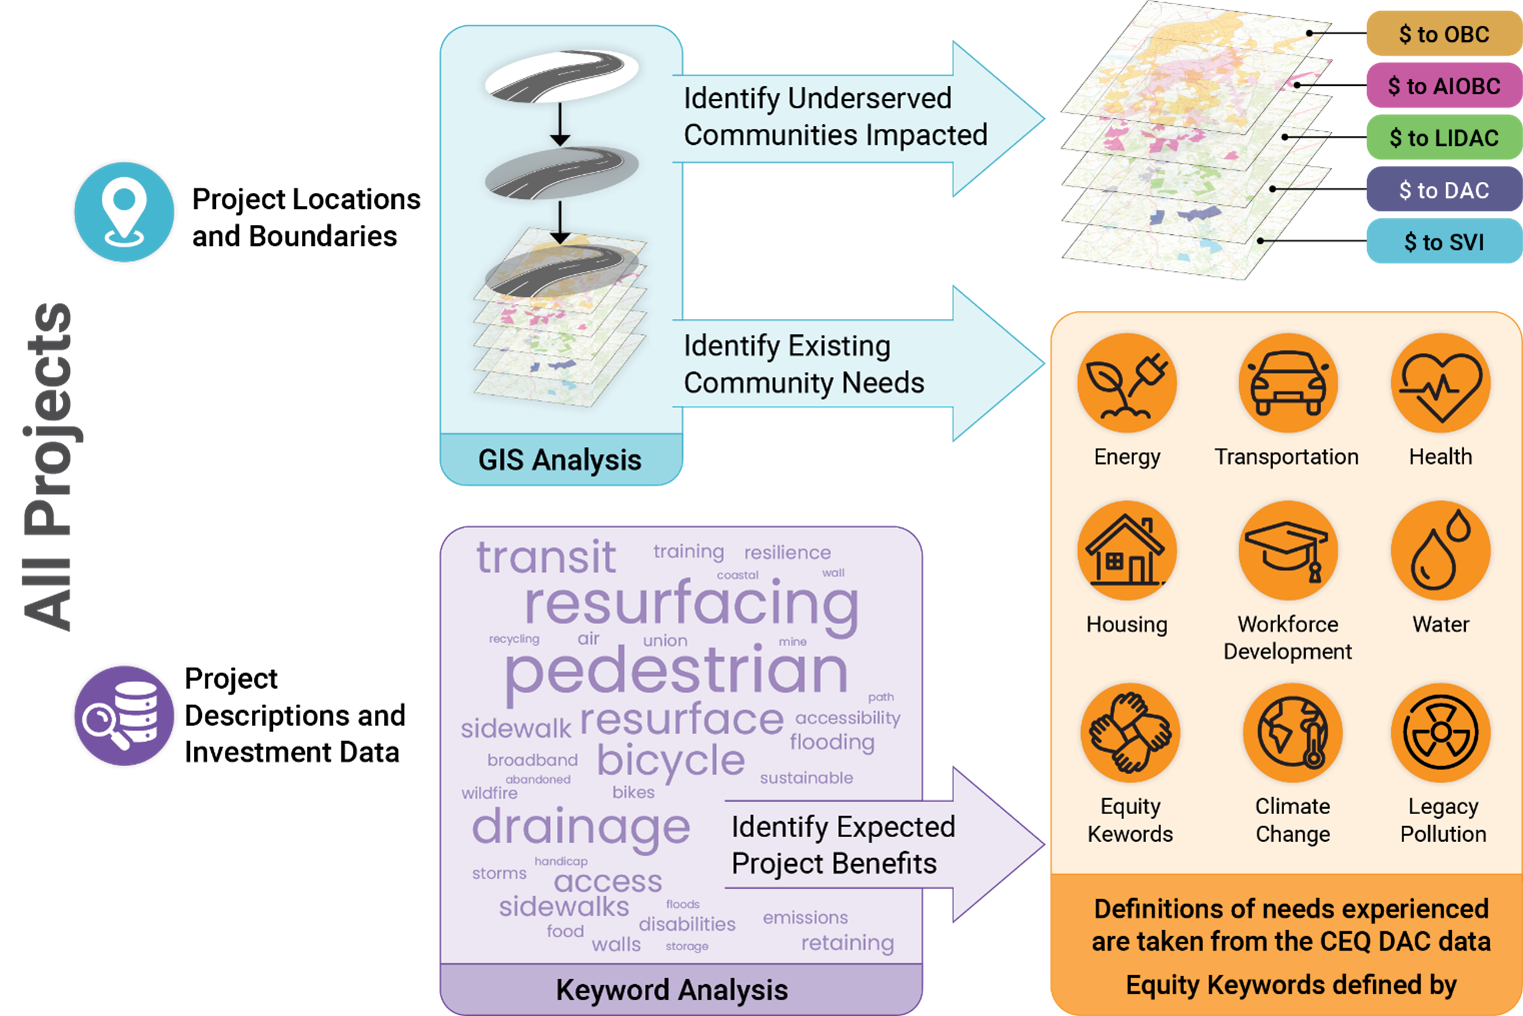
Overview of Data
This dashboard utilized formula project funding authorization and Agency project descriptions from New Jersey’s Board of Public Utilities (NJBPU), Department of Transportation (NJDOT), NJ TRANSIT, and Department of Environmental Protection (NJDEP).[1] Multiple datasets were used in identifying underserved communities including from the Council on Environmental Quality (CEQ) Climate and Economic Justice Screening Tool (CEJST), NJDEP Environmental Justice Mapping, Assessment and Protection Tool, Centers for Disease Control and Prevention (CDC) Social Vulnerability Index (SVI), the Environmental Protection Agency (EPA) Low-Income and Disadvantaged Communities (LIDAC), and the NJDEP Adversely Impacted Overburdened Communities (AIOBC) These data sources were selected to utilize effective tools in identifying the indicators of underserved, overburdened and disadvantaged communities in alignment with national best practices as well as New Jersey community definition practices.
| Underserved Community Designation | Definition | Source |
| Overburdened Communities (OBC) | Census Block Groups that meet any of 3 conditions: at least 35% of households under twice the poverty line, 40% of minority population or tribal community or 40% of households with limited English proficiency. | Documentation (NJ Priority Climate Action Plan) |
| Adversely Impacted Overburdened (AIOBC) | Census Block Groups identified as OBCs that also present higher environmental stressors than the surrounding areas (either MPO, County or State-wide). There are 26 stressors grouped in 8 categories: Air Pollution, Contaminated Sites, Transportation, Waste Facilities, Water, Health, Proximity and Social Factors. | Documentation (NJ Priority Climate Action Plan) |
| Social Vulnerability Index (SVI) | Census Tracts with an overall combined index score of vulnerability above the 75th percentile nationally. | Documentation (SVI 2020) |
| Disadvantaged Communities (CEJST) | Census Tracts that meet any of the thresholds of 8 categories of environmental justice burdens. | Documentation and Methodology (CEJST) |
| Low-Income Disadvantaged (LIDAC) | Census Block Groups identified as Disadvantaged by the CEJST burden categories OR above the 90th percentile in EJ Screen’s supplemental indexes, either Nation- or State-wide | Documentation (EJ Screen) and Documentation and Methodology (CEJST) |
[1] In the case of NJDOT, individual projects exported from the FHWA Financial Management Information System (FMIS) typically only have geographic information in the project description field. For the purpose of this analysis, these projects were assigned the corresponding project description from the “parent project/program” in the New Jersey E-STIP, which provides further information about the type of work being performed and anticipated benefits.
Geospatial Analysis
The spatial impact of each project was evaluated by determining an impact area on an individual-project level. A one-mile buffer impact area is assigned to projects represented with point or line geometries, while projects with region/polygon geometries are unmodified. This is the defined geographic area that represents the communities impacted by the project.
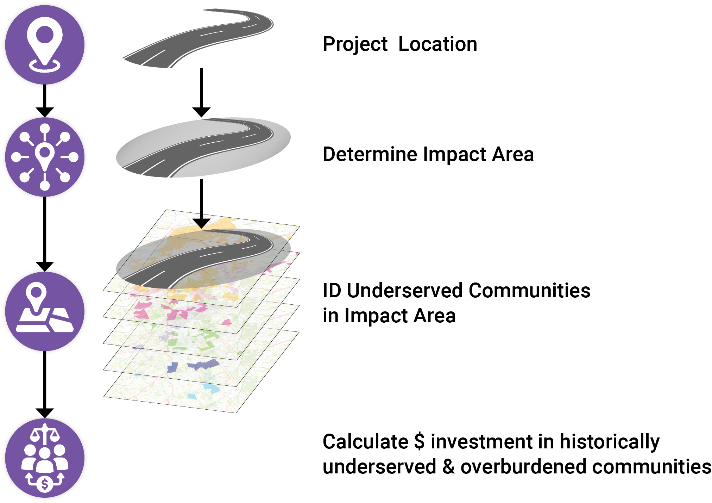
Using GIS software, the project impact area as defined above is overlaid with five (5) geographic definitions of equity communities, as described in Table 2. A spatial analysis process selects which census tracts or block groups overlap with each project’s impact area. The corresponding OBC, AIOBC, LIDAC, DAC, SVI data for the selected tracts is summarized and assigned to each project, including the share of the population that falls under any of the equity metrics coming from the source datasets. Using this data, the dashboard visualizes, on a project level, the percentage and total dollar value of BIL funding is being directed to equity communities, as well as the particular DAC burden the population living within the impact area experiences. This information is also aggregated across all projects, weighted by BIL funding amount, to quantify the overall impact of BIL funding on equity communities.
Table 1. Geographic Equity Data Sources
| Geographic Equity Data Source[1] | Underserved Community definition used |
| NJDEP Overburdened Communities (OBC) 2021 definition (Block Group) | Block groups flagged as OBCs or “Adjacent” are treated as equity communities. |
| NJDEP Adversely Impacted Overburdened Communities (AIOBC) 2021 definition (Block Group) | Block groups flagged as AIOBCs or “Adjacent” are treated as equity communities. |
| EPA’s Low-income and Disadvantaged Communities 2023 definition (Block Group) | Block groups with an EJ Screen National or State Index over the 90th percentile or flagged as “Tribal” (Off-Reservation Trust Lands, American Indian Reservations, Alaska Native Allotments or Villages, and Oklahoma Statistical Areas) are designated as equity communities, as well as those within CEJST tracts with one or more burdens. |
| CEQ CEJST version 1.0. burden data (Census Tract) | Census tracts in the CEJST dataset that present one or more burdens are treated as equity communities. |
| CDC Social Vulnerability Index (SVI) 2020 data (Census Tract) | Census tracts in the SVI dataset where the Overall Vulnerability is above the 75th percentile are treated as equity communities. |
[1] The CEJST and SVI data are both in pre-2020 Census boundary definitions, while OBC data use 2020 Census boundaries. The OBC block group data is combined to 2021 ACS 5-year estimate data and aggregated at the census tract level to get the population share of the total population living in an overburdened community.
Project Categorizations
After determining how project funds were allocated within communities in the geographic analysis, key word search criteria were established to identify where agency-provided project descriptions related to the CEJST categories that indicated community benefits in line with the BIL focus areas. These key words were located within the project descriptions provided by NJ agencies referenced in the previous section “Overview of Data”. Key words were selected to align closely to the CEJST category definitions and datasets used within the CEJST Tool with key words provided in Table 1 below:
Table 2. Project Categorization Keywords
|
Icon |
CEJST Categories | Key Word Considerations |
| Equity (non-CEJST) | rural, low-income, tribal, public outreach, equity, disadvantaged, Justice40, Justice 40, MBE, DBE, WBE, MWBE | |
| Workforce Development | workforce development, apprenticeship, economic development, job training, upskill, union, trade union, training, Minority Business Enterprise (MBE), Disadvantaged Business Enterprise (DBE) | |
| Health | public health, food, asthma, PM 2.5, air quality, diabetes, heart disease | |
| Legacy Pollution | pollution reduction, waste, remediation, brownfield, hazardous waste, superfund, point source, abandoned mine | |
| Water/Wastewater | CSO, lead pipe, lead service, service lines, conveyance, storage, wastewater, UST, underground storage, leak | |
| Housing | greenspace, broadband, small cell, affordable housing, park space, green space, housing cost, housing burden | |
| Energy | rate payer, weatherization, renewable, EV, electric, charging, charger, energy cost, energy burden | |
| Climate Change | pollution reduction, emissions, flood, flooding, storm, greenhouse, recycling, wildfire, resilience, sea level rise, erosion, coastal, adaptation, sustainable, stormwater, permeable, retaining wall, run off, runoff | |
| Transportation | pedestrian, bicycle, ADA, disability, wheelchair, handicap, Trails, Path, Bikeway, streetscape, transit, accessibility, greenspace, access, traffic noise, micromobility, sidewalk trail, bike, pavement, resurface, resurfacing, green infrastructure, low-impact |
After the categorization of projects by keyword search; a manual quality review of categorization was performed based on the following criteria.
- Any project assigned to CEJST category “None” (i.e. did not have any key words in their project description).
- Any project having a cross-sector categorization (i.e. DOT/NJT projects assigned to non-Transportation CEJST category, BPU assigned to non-Housing, DEP assigned to non-Climate Change or Legacy Pollution).
- Any projects having a minimum BIL funding amount equal to $10M.
- Any projects referencing general equity key words.
During manual review, projects highlighted by the above-mentioned criteria were determined to either be appropriately categorized by the keyword consideration (no action needed) or requiring to be recategorized (removed from or added to a different category than that assigned by the keyword considerations).
Investment and Need Alignment
Investment and need are considered aligned when the benefits expected based on the project scope match the needs (as identified by CEJST categories of burden) of the community living in the area it is being implemented. Project investment and needs alignment are identified when the keyword considerations search identifies that the project investment category matches one or more burdens experienced by the community in the project’s impact area. For example, when a project is categorized as targeting transportation benefits according to the project scope description, and the nearby community is experiencing a transportation burden, according to CEJST spatial data, there is alignment of the investment and community needs.
Limitations and Considerations
Data
Project descriptions provide the source material to categorize any project’s potential to confer benefit and/or determine categorization into CEJST categories of burden. Descriptions are provided from different NJ agencies with inconsistent levels of detail. Project descriptions provided may not provide a comprehensive understanding of the project potential impacts.
Methods
The methodology does not currently include an end of project check to confirm that the project description that determined the project investment category and/or alignment with investment need were achieved in the way they were described.
The criteria established for manual quality review are thresholds set such that all projects do not receive a detailed review after placement through the key word search. This approach means there may be limitations to represented projects that could be attributed to a category that is not the best fit for the project outcomes or there may be projects that have been excluded from the analysis.