 |
 |
 |
 |
 |
 |
|
| | | | |
|
|
| | | | | |
 |
|
Phase Two: Moving Science into Action
Modeling
The Barnegat Bay-Little Egg Harbor estuary, comprised of the main-stem Barnegat Bay, Manahawkin Bay, and Little Egg Harbor, and the Toms and Metedeconk River embayments, spans 70 km along New Jersey’s Atlantic coast. The Barnegat Bay-Little Egg Harbor is relatively shallow (mean depth 1.6 m), narrow (~1 - 6 km wide), and has a mid-tide surface area of 279 km2 and an approximate volume of 4.37 x 10⁸ m3.
Ocean/estuary exchange occurs through three inlets/outlets; the Little Egg and Barnegat Inlets in the south and central, respectively, and the Manasquan Inlet via the Point Pleasant Canal in the north. Tidal discharge at Point Pleasant Canal is more than an order of magnitude smaller than that for Little Egg Inlet and Barnegat Inlet.
The bay has a mean tidal range of 0.2–1 m. Widest range occurs at inlets and in Barnegat Bay-Little Egg Harbor south.
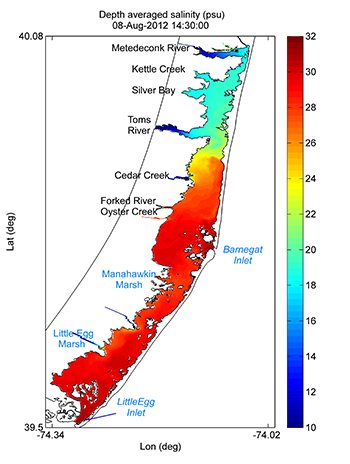
The Toms and Metedeconk Rivers in the northern portion of the watershed provide the majority of freshwater inflow, promoting a strong N-S salinity gradient (9 to 32 ppt).
The Oyster Creek Nuclear Generating Station, located to the northwest of BI, provides high flow pulses and thermal load.
Map of Study Area
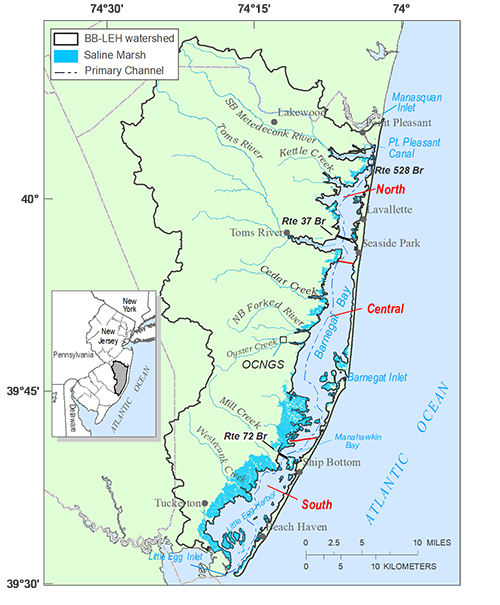
Model development relied upon data and results derived from a number of studies.
- Sea-floor mapping (boat- and aircraft-based) of the bay was conducted to provide a foundation for estuarine circulation and to improve understanding of benthic conditions.
- Continuous stage and discharge measurements were made at 7 tributary, 3 inlet, and 3 in-bay stations. Tidal stage was measured at an additional 7 stations.
- Water-column samples for analysis of nutrients, carbon, chlorophyll a, SSC (Suspended Sediment Concentration), and other physical and chemical characteristics were collected weekly during Apr-Sep and twice monthly thereafter at 12 tributaries and 15 bay stations during 2011-2013. Surface and bottom samples were collected at each in-bay station and supplemented with continuous water-quality data from 4 in-bay and 1 tributary monitoring station. During summer, two intensive sampling events (4 consecutive days; 6 samples per day) were conducted.
Other data/research used to inform model development include bottom sediment characterization and chemistry, light attenuation, sediment oxygen demand and sediment nutrient flux, phytoplankton characterization, and wetlands denitrification studies.
Estuarine Bathymetry and Water Quality Monitoring Stations
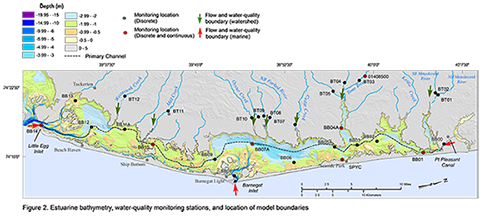
Click image above to enlarge.
The modeling approach involves a one-way, offline coupling of a hydrodynamic model to a water-column nutrient model allowing each to run independently, to address differences in domain and spatial discretization, as well as computational limitations of the water-quality model. In this application, a fine-scale Regional Ocean Modeling System was externally coupled to a coarser-scale Water Quality Analysis Simulation Program model. Because communication between the two models was not available prior to the study, development of linkage routines was necessary. The baseline simulation period for both models was March 7 to September 30, 2012 (208 days).
Developed using the Coupled-Ocean-Atmosphere-Wave-Sediment Transport Modelling System. The hydrodynamic component, a three-dimensional, finite difference, free-surface, primitive equations ocean model, has been successfully applied to shallow, estuarine environments (Shchepetkin and McWilliams, 2005).
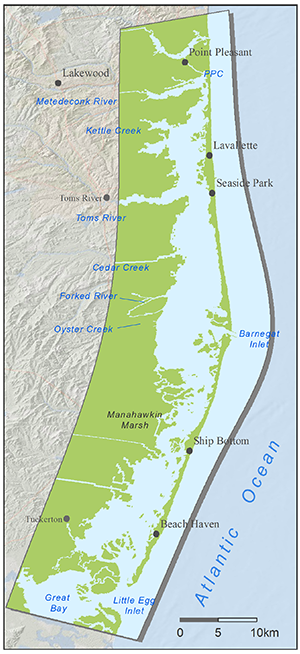
- Domain - Manasquan Inlet to Great Bay, including Barnegat Bay-Little Egg Harbor
- Grid - 160 x 800 x 7 cells (900)
- Horizontal – curvilinear grid with resolution 40-200 meters; complex shoreline resolved via cell masking at land-estuary interface
- Vertical – stretched terrain-following coordinates; resolution variable (7 layers)
- Time step - 5 seconds
- Wetting/drying activated
- Tidal forcing (ADCIRC North Atlantic database) and riverine flow input (United States Geological Survey gaging stations)
- Atmospheric forcing (bulk formulae from North American Mesoscale model), salinity and temperature (ESPreSSO model; Wilkin and Hunter, 2013)
- Waves, sediment transport1
1Not passed to water-quality model.
Hydrodynamic Model of Barnegat Bay-Little Egg Harbor
Hydrodynamic model representation of Barnegat Bay-Little Egg Harbor.
Wet cell areas in blue, dry cell areas in green. (Cell boundaries not shown).
 References
Shchepetkin, A.F., and McWilliams, J.C., 2005. The Regional Ocean Modeling System: a splitexplicit, free-surface, topography following coordinates ocean model. Ocean Modelling, 9, 347–404.
Wilkin, J.L. and Hunter, E.J., 2013. An assessment of the skill of realtime models of Mid-Atlantic Bight continental shelf circulation. Journal of Geophysical Research: Oceans, 118(6).
United States Environmental Protection Agency’s Water Quality Analysis Simulation Program with advanced eutrophication routines (Wool and others, 2003) was used to simulate bay water quality. The model is configured to simulate 16 state variables including two composite phytoplankton classes, a diatom and a non-diatom group. State variables used in this application are listed in Table 1.
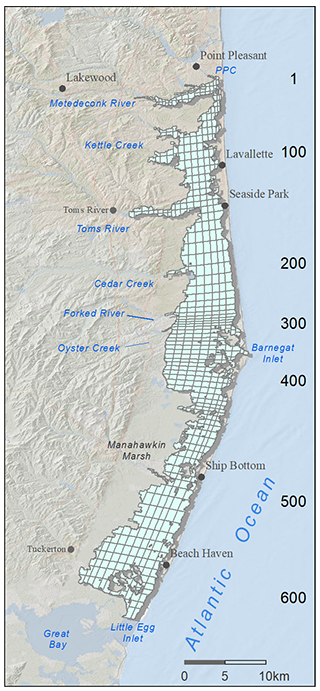
- Domain – Point Pleasant Canal to Little Egg Inlet; Grid 609 x 3 cells (1827)
- Horizontal – resolution 300 to 1400 meters; 1-to-many connectivity
- Vertical – 7 ROMS layers collapsed to 3; resolution variable
- Time step – 60 seconds
- Inlet/tributary boundaries – derived from observed (discrete and continuous) data for 2012 conditions. Specified for all state variables at each flow boundary (Daily to weekly temporal series).
- Unmonitored sub watersheds – Load estimation for Nitrogen, Phosphorus, Silicon species, Carbonaceous Biological Oxygen Demand ultimate by representative chemistry and hydrograph generation (bi-weekly time series)
- Atmospheric Deposition (dissolved inorganic nitrogen only; monthly time series)
- Direct groundwater discharge – MODFLOW water-budget analysis plus representative groundwater chemistry (constant)
- Saline Marsh – Nitrogen loss (denitrification) and Carbonaceous Biological Oxygen Demand ultimate load per unit area
- Dynamic Light Model – accounts for algal self-shading, suspended sediment concentration, dissolved inorganic nitrogen, and background attenuation
- Benthic sediment fluxes – dynamically simulated (dissolved inorganic nitrogen, phosphate, sediment oxygen demand)
Table 1. State variables used in this application of WASP
| Ammonia Nitrogen |
Carbonaceous Biological Oxygen Demand ultimate (marine) |
| Nitrate Nitrogen |
Dissolved Oxygen |
| Dissolved Organic Nitrogen |
Detrital Carbon |
| Inorganic Phosphorus |
Detrital Nitrogen |
| Dissolved Organic Phosphorus |
Detrital Phosphorus |
| Inorganic Silica |
Detrital Silica |
| Dissolved Organic Silica |
Phytoplankton (non diatom) |
| Carbonaceous Biological Oxygen Demand ultimate (watershed) |
Phytoplankton (diatom) |
Water Quality Model of Barnegat Bay-Little Egg Harbor
Water-quality model representation of Barnegat Bay-Little Egg Harbor.
Numbers on map refer to general location of Water Quality Analysis
Simulation Program grid segment.
 References:
Wool, T.A., Ambrose, R.B., Martin, J.L., and Comer, E.A., 2003, Water quality analysis simulation program (WASP), Version 6.0, Draft user’s manual: U.S. Environmental, Region 4, Atlanta, 267p
Continuous data for hydrodynamic skill assessment is available at each of the inlets, from four discharge gaging stations, and several additional tide stations within the bay.
The model was calibrated primarily by altering the bottom roughness coefficient to match tidal stage and discharge (Defne and Ganju, 2015). Hydrodynamic model skill was considered very good to excellent in predicting tidal discharge and water levels, and good to excellent for salinity and water temperature. Agreement between observed and predicted water levels at stations located at the three bridge crossings is shown below. A good fit is generally demonstrated between simulated and observed salinity, however a late summer decrease observed at most monitoring stations is not captured.
Comparison of observed and predicted water levels (Water Quality Analysis
Simulation Program aggregate data) at stations located at the three bridge crossings.

Observed and predicted salinity at stations
BB01 and BB04A, Barnegat Bay-Little Egg Harbor north.

Salinity Gradient:
Depth Averaged Salinity During Mid-Flood Tide
Map showing depth-averaged salinity during
mid-flood tide, August 8, 2012.
Residence Time:
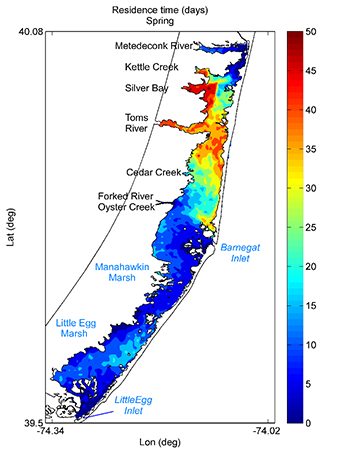
A Lagrangian particle-tracking model was used to estimate residence time throughout Barnegat Bay-Little Egg Harbor. Residence (or retention) time is important when considering the exposure period of marine organisms to polluting substances and is a principal physical control on primary and secondary effects of eutrophication.
- Consistent with prior field studies, model results indicate a northward residual circulation from Little Egg Inlet, promoting northward transport and more efficient flushing of Barnegat Bay-Little Egg Harbor south.
- Results indicated that meteorological events and remote coastal forcings exert more control on removal of particles than riverine inflow.
- Residence time varies substantially with location; shortest residence times occur near the inlets and longest, near Kettle Creek, Silver Bay and south to Cedar Creek (up to 50 days)
- Average residence time for a Spring simulation (Mar-Apr) is 15.6 days. Average residence time in the north, central and south is 26.7, 15.2, and 9.0 days, respectively
- During summer (not shown) average residence time in Barnegat Bay-Little Egg Harbor increases to 16.8 days.
Average Residence Time - Spring 2012
Map showing average residence time during
spring of 2012, Barnegat Bay-Little Egg Harbor
|
 |
|
|
 |
 |
 |
 |
 |
|
 |