Delaware • New Jersey • Pennsylvania
New York • United States of America
|
Indicator |
Status |
Present Condition |
Trend |
|
Salt Line Location |
Good |
Protective of public supply |
↔ |
|
Water Use Efficiency |
Good |
Per capita use improving (decreasing) |
↑ |
|
Water Use |
Good |
Human needs being met; instream needs being evaluated |
↔ |
|
Consumptive Use: Public |
Good |
Has decreased, although population has increased |
↑ |
|
Consumptive Use : Power Generation |
Fair |
Has increased over past |
↓ |
|
Areas of Groundwater Stress |
Fair |
No additional management areas identified |
↔ |
|
↑ Improving ↓ Worsening ↔ No Trend or Stable |
|||
- A million gallons (MG) of water will fill up 20,000 bath tubs
- A billion gallons (BG) of water = 1,000 million gallons
- 8.4 billion gallons of water are pumped daily from Delaware River Basin reservoirs, streams, and wells
- Over 15 million people rely on Delaware River Basin water (~1 in every 20 Americans)
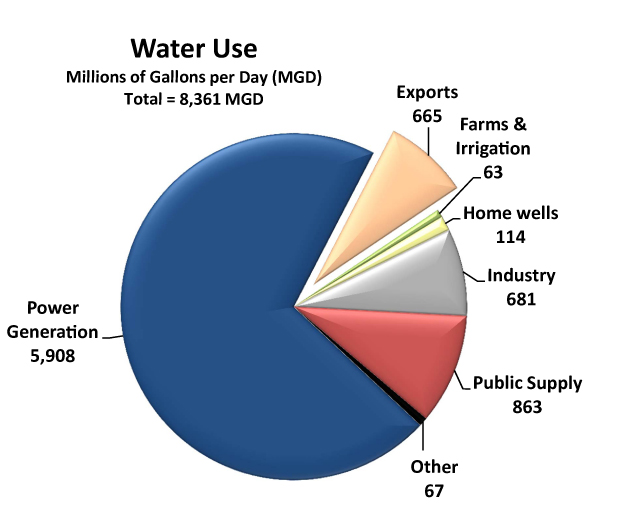
- 92% of all water withdrawn is used in the basin (7.7 BGD)
- 8% is exported (665 MGD)
- 77% of in-basin water is used to generate power (5,908 MGD)
- 11% of in-basin use is for public water supply (863 MGD)
- 82% of people are on public water supply; 18% have their own well
- One gallon of water weighs more than 8 pounds
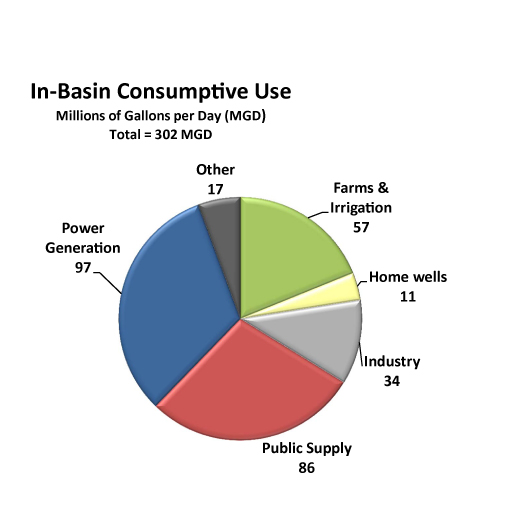
Water geeks speak a different language. Consumptive use or loss of water means that the water is not deliberately returned to the watershed. Most of the water taken from wells or streams is used, treated, and put back into streams and rivers. Overall - after exports - about 4% doesn't get returned and is identified as "consumptive use."
♦ Learn more about basin water use
♦ Learn more about consumptive use (pdf 4.1 MB; TREB Ch. 2, pgs. 6-8)
All of us use water. Most of us (82%) use water delivered as public supply; a few of us (18%) have our own well. We measure water use in gallons per person (capita) per day (gpcd), and compare this number over time. Based on recent (2007) reported water use, the basin-wide average is 116 gallons per person per day. In 2003, the average was 133 gpcd. The good news is that - even with more people - per capita use and total water use has declined. We are using water more efficiently. This is a very positive trend driven by improvements in water conservation - like low flow toilets and showers - and greater public awareness.
♦ Learn more about per capita water use (pdf 4.1 MB; TREB Ch. 2, pgs. 8-10)
♦ Learn more about DRBC's water conservation policies
♦ Learn more about DRBC's new approach to identify and control water loss in the basin
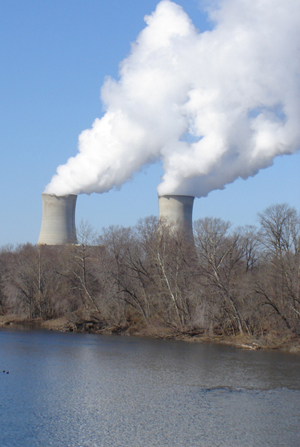
While water and electricity are usually not a good mix, making electricity traditionally requires a lot of water - 77% of all water use in the basin is involved in power generation. As our need for electricity has increased in the last twenty years, so has our use of water to generate it. How much is actually "consumed" (see above) depends on the type of cooling system used. Once-through systems use a heat absorber, use more water, but have a lower consumptive use (<1%). Systems that use tall evaporative cooling towers need less water, but have a high consumptive use (>90% is evaporated). The amount of water used to create electricity now accounts for one third of all the water used consumptively. Recently, rules were changed to require recirculating systems at new power generating plants. While requiring less water to run, such plants will have a higher percentage of consumptive use. This is a mixed result, since more water can remain in the rivers, but less will be immediately returned to be used again.
♦ Learn more about tracking supply and demand (pdf 4.1 MB; TREB Ch.2, pgs. 2-5)
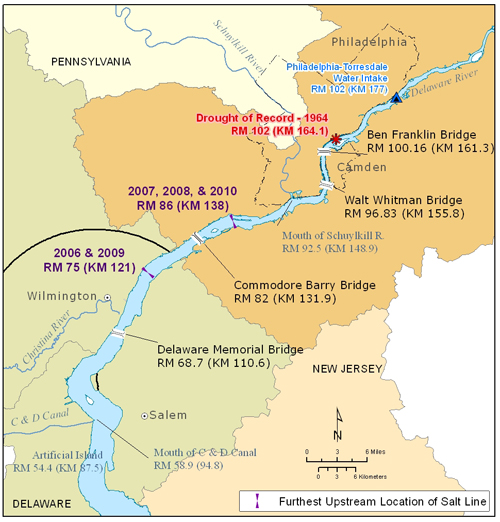
The amount of water passing by at Trenton - the location of the most upstream point of the Delaware River that is influenced by the tides - is automatically monitored every fifteen minutes. This information is important. Low flow conditions could be a problem for water supplies taken from the river south of Trenton. When flow is very low, salty water from the Delaware Bay moves upstream and can cause trouble for drinking and for industrial use. Monitoring the flow gives managers time to order releases from reservoirs far upstream. The additional water protects drinking water supplies by keeping the "salt line" a safe distance downstream of water intakes. With good management, the safe distance has been successfully maintained for decades. While we have good flow information, we need better tools for predicting conditions in advance to make sure there will be enough water where and when we need it in the future.
DRBC has developed a real-time flow and transport model to protect drinking water intakes from spills and other mishaps. The model was used in November 2012 to assess potential vulnerability from a railroad accident and vinyl chloride spill in Mantua Creek (N.J.).
♦ Learn more about how DRBC's transport model was used after the Nov. 2012 spill (pdf 895 KB)
♦ Watch the model in action
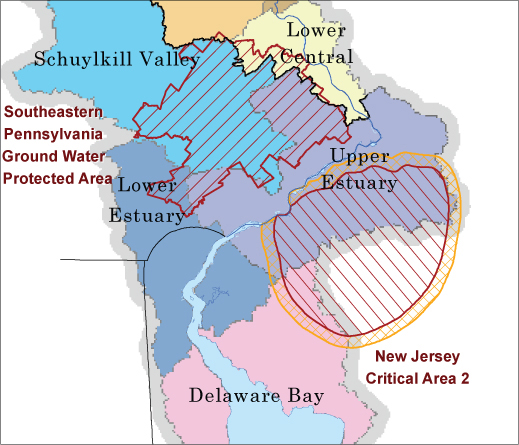
Two areas of groundwater stress are under special management; no new areas have been identified for special management in the basin at this time.
SEPA-GWPA
DRBC manages the Southeastern Pennsylvania Groundwater Protected Area (SEPA-GWPA), where 12 of 78 watersheds are within or beyond 50% of their recommended allocation limit. Recent use of data indicates a slight decrease in groundwater use in the SEPA-GWPA, and no additional management efforts are necessary at this time.
♦ Learn more about the SEPA-GWPA
New Jersey Critical Area 2
In southwest New Jersey, NJDEP limits the allocation of groundwater in Critical Area 2 and, with USGS, regularly checks groundwater levels, which are generally improving.
♦ Learn more about groundwater availability (pdf 4.1 MB; TREB Ch.2, pgs. 11-13)