Delaware • New Jersey • Pennsylvania
New York • United States of America
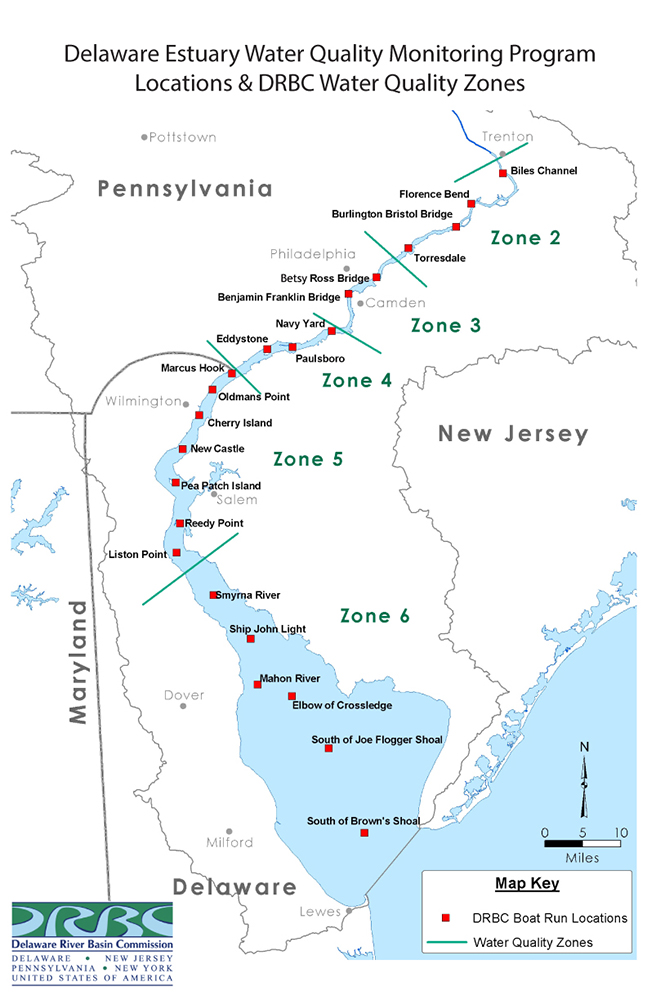
Initiated in 1967, DRBC's Delaware Estuary Water Quality Monitoring Program (aka the Boat Run) is one of the longest running monitoring programs in the world.
Each year, DRBC contracts with the Delaware Dept. of Natural Resources and Environmental Control (DNREC) to collect surface water samples in the Delaware Estuary, from the head of tide at Trenton, N.J. to the mouth of the Delaware Bay.
- Navigating the Depths: Inside the Delaware Bay's Longest-Running Water Quality Monitoring Program (article in DNREC's Outdoor Delaware online magazine about the Delaware Estuary Water Quality Monitoring Program; 2024)
Samples are collected monthly at 22 stations to manage water quality and ensure criteria are being met. Currently, samples are collected from March/April - October.
This monitoring program provides accurate, precise and defensible estimates of the surface water quality of the Delaware Estuary and allows assessment of water quality criteria compliance.
Sample analysis includes:
- Dissolved Oxygen, pH, temperature, specific conductance, turbidity, secchi depth, PAR
- Nutrients (ammonia, nitrate + nitrite, phosphorus)
- Sodium, chloride, chlorophyll-a
- Bacteria
- Metals
- 1,4-Dioxane
- 6PPD-Q
- PFAS
- low level Bromide (a bromide/chloride comparison can help determine if increased chloride levels are from road salts)
Data Availability
- Bacterial sampling results for fecal coliform and enterrococcus are posted below
- Other data are added to the publicly available U.S. EPA Water Quality Portal
Map of Sampling Locations
- View map on ArcGIS
- View map as PDF (archived)
- View Map of Delaware Estuary Water Quality Zones (archived PDF)
- View DRBC River Mileage System
Typically, once monthly from March to October, bacteria samples are collected at the 22 stations. Fecal coliform and enterococcus bacterial data (unit of measurement is cfu/100mL) are used to determine compliance with the Commission's water quality standards for recreational use.
DRBC's bacterial water quality criteria standards are based upon the average of several samples over a period of time. While individual samples taken on a single day, such as those reported here, may exceed the number listed under the standard column, the standard is not violated until the average of multiple samples within a Water Quality Management Zone exceeds the standard value. Bacterial data are highly variable, and individual sample exceedances commonly occur following rainfall events due to non-point source runoff and discharges from combined sewer overflows.
Most Recent Bacterial Sampling Data: June 2026
|
Sampling |
River |
6/22/26 Enterococcus |
Enterococcus |
6/22/26 |
Fecal |
|
Trenton
|
131.04
|
27
|
33
|
60
|
200
|
|
Florence
|
122.4
|
46 |
33
|
48
|
200
|
|
Burlington
Bristol Br. |
117.8
|
4
|
33
|
73
|
200
|
|
Torresdale
|
110.7
|
6 |
33
|
57
|
200
|
|
Betsy Ross Br.
|
104.75
|
8
|
88
|
87
|
770
|
|
Benjamin
Franklin Br. |
100.2
|
10
|
88
|
80
|
770
|
|
Navy Yard
|
93.2
|
4
|
88
|
40
|
770
|
|
Paulsboro
|
87.9
|
13
|
88
|
30
|
770
|
|
Eddystone
|
84.0
|
13
|
88
|
70
|
770
|
|
Marcus Hook
|
78.1
|
6
|
35
|
120
|
200
|
|
Oldmans Pt.
|
74.9
|
19
|
35
|
150
|
200
|
|
Cherry Island
|
71
|
24 |
35
|
210
|
200
|
|
New Castle
|
66.0
|
34
|
35
|
410
|
200
|
|
Pea Patch Is.
|
60.6
|
41
|
35
|
470
|
200
|
|
Reedy Island
|
54.9
|
10
|
35
|
32 |
200
|
|
Liston Pt.
|
48.2
|
10
|
35
|
26
|
200
|
|
Smyrna River
|
44.0
|
10
|
35
|
22
|
200
|
|
Ship John Light
|
36.6
|
ND
|
35
|
3
|
200
|
|
Mahon River
|
31.0
|
ND
|
35
|
1
|
200
|
|
Elbow of
Crossledge Shoal |
22.75
|
ND
|
35
|
12
|
200
|
|
South of Joe
Flogger Shoal |
16.5
|
ND
|
35
|
2
|
200
|
|
South Brown
Shoal |
6.5
|
ND
|
35
|
ND
|
200
|
Please Note:
- If results are flagged with the indicator "QC," the calculated precision between the analytical and duplicate results is outside the quality control limit for this test.
n/a = data not available
ND = non-detect
Questions? Contact
- Dr. Jeremy Conkle, jeremy.conkle@drbc.gov
2026 Data (archived PDFs)
DRBC staff developed an interactive application that allows the user to explore water quality data collected from the DRBC Delaware Estuary Water Quality Monitoring Program since 1999.
Check out the Data Explorer
The data are displayed as box plots by river mile or by month and include the following water quality parameters (described below):
- Water Temperature (oC)
- Salinity (ppt)
- Nitrate + Nitrite (mg/L)
- Dissolved Oxygen Saturation (%)
- Dissolved Oxygen (mg/L)
- Secchi Depth (m)
- Turbidity (NTU)
- Dissolved Organic Carbon (DOC) (mg/L)
- Silica (mg/L)
- Phosphate (mg/L)
Descriptions of Water Quality Parameters
- Water Temperature (measured in degrees Celsius) is an important factor for the health and survival of native fish and aquatic communities, as certain species need specific temperature ranges to survive. Temperature can affect embryonic development, juvenile growth, adult migration, competition with non-native species, and the relative risk and severity of disease. Temperature also affects the concentrations of dissolved oxygen in water, with higher concentrations occurring in colder temperatures.
- Salinity (measured in parts per thousand) is a measure of how much salt is in the water. The Delaware Estuary is believed to contain one of the largest freshwater tidal prisms in the world. It is important to monitor and track the concentrations and movement of salt in the Delaware Estuary, as it provides drinking water for over one million people. If too much salt from the ocean encroaches on drinking water intakes, the Delaware's suitability as a source of drinking water is negatively impacted.
- Nitrate + Nitrite (measured in milligrams per liter) is the sum of two forms of nitrogen, Nitrate (NO3), which is relatively stable, and Nitrite (NO2), which usually oxidizes to Nitrate quickly. Together, these represent the dominant form of nitrogen in the Delaware Estuary. Nitrogen is a nutrient, a substance assimilated by living things that promotes growth. Other examples of nutrients are phosphorus, silica, and iron, of which the latter two are considered trace nutrients.
Nitrogen (along with phosphorus) is necessary for aquatic plant growth, which supports the rest of the aquatic food chain. It is derived from a variety of natural and artificial sources, including decomposition of plant and animal materials, man-made fertilizers, and sewage. Rainfall also can be a significant source of nitrates. Excessive concentrations of nutrients can cause undesirable plant growth, deleteriously impacting water quality, for example, by reducing the amount of dissolved oxygen in the water column.
- Dissolved Oxygen (DO) (measured by percent saturation or by milligrams per liter) refers to the concentration of oxygen gas incorporated in water. Oxygen enters water both by direct absorption from the atmosphere and as a by-product of photosynthesis from algae and aquatic plants. The amount of dissolved oxygen present is affected by temperature; cold water generally contains more DO than warm water. Sufficient DO is essential to growth and reproduction of fish and other aerobic aquatic life. How much DO an aquatic organism needs depends upon its species, its physical state, water temperature, pollutants present, and other factors.
Oxygen levels in water bodies can be depressed by the discharge of oxygen-depleting materials (measured in aggregate as biochemical oxygen demand, BOD, from wastewater treatment facilities), from the decomposition of organic matter including algae generated during nutrient-induced blooms, and from the oxidation of ammonia and other nitrogen-based compounds. The Delaware Estuary has historically been plagued by anoxic and hypoxic conditions (the lack of oxygen or the severe depression of oxygen, respectively) that resulted from the discharge of raw and poorly treated wastewater. Although the estuary has seen a remarkable recovery since the 1960s, with fish such as striped bass and sturgeon now able to spawn (at least some of the time) within the estuary, dissolved oxygen remains a critical issue for the estuary because of continued depression of oxygen levels far below saturation and because of possible indirect effects from elevated nutrient loadings.
- Secchi Depth (measured in meters) is a measure of the clarity of water. It is determined by lowering a disk with black and white markings into the water, until the point at which the markings are no longer visible. The higher the secchi depth number, the clearer the water. Water clarity is important for the growth of submerged aquatic vegetation and the production of phytoplankton in the water. Like most estuaries, the Delaware Estuary has a natural area of low clarity, called the Estuary Turbidity Maximum (ETM), usually located where the salt water from the ocean meets the fresh water from the river.
- Turbidity (like secchi depth, but measured in Nephelometric Turbidity Units) is also a measure of water clarity. Turbidity is determined using an instrument called a nephelometer, which measures how much light can pass through a fixed length of water.
- Dissolved Organic Carbon (DOC) is a general term for organic molecules in an aquatic system. It serves as a food supplement for microorganisms and is an indicator of organic loadings in streams.
- Silica is a compound of silicon and oxygen and is the most abundant element on Earth after oxygen. Trace amounts are commonly found in all natural water supplies.
- Phosphates enter waterways from human and animal waste, phosphorus rich bedrock, laundry, cleaning, industrial effluents, and fertilizer runoff. Phosphates are a nutrient for plant growth, but can become detrimental to a water body in high levels. Increased phosphates can over fertilize aquatic plants, causing increased eutrophication and subsequent decreased dissolved oxygen levels.