Delaware • New Jersey • Pennsylvania
New York • United States of America
- Dissolved Oxygen 101
- Non-Tidal Delaware River DO Levels
- Delaware Estuary DO Levels
- Nutrients 101
- Addressing Excess Nutrients in the DRB
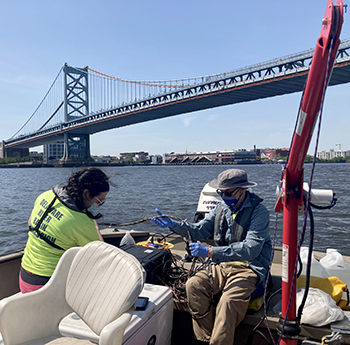 |
| DRBC staff collects a sample from the tidal Delaware River to monitor dissolved oxygen levels. Photo by DRBC. |
Oxygen is a fundamental requirement for nearly all animal life on our planet, including aquatic life, such as small protozoans, insects and fish. They use the gaseous oxygen dissolved in water - dissolved oxygen, or DO - to respire (breathe).
DO is an important metric for good water quality because it is essential for growth and reproduction of aerobic aquatic organisms.
The levels of DO required for aquatic life vary. Different species of fish have different DO needs, as do their juvenile or adult life stages. Whether they are migratory or resident species also matters.
How does Oxygen Enter Water?
• By direct absorption from the atmosphere; and
• As a by-product of photosynthesis from algae and aquatic plants.
Causes of Lower DO Levels Include
- Saltier water (higher salinity) carries less oxygen than fresh water;
- Warmer water generally contains less oxygen than colder water. This means that DO varies daily as water and air temperatures change and also seasonally;
- When oxygen-depleting materials are discharged from wastewater treatment plants;
- Algal blooms, or other decomposition of organic matter; and
- The oxidation of ammonia and other nitrogen-based compounds.
In the non-tidal river, north of Trenton, N.J., dissolved oxygen levels - and water quality in general - is better than standard. This is due to the DRBC's Special Protection Waters (SPW) program, which is designed to prevent degradation of water quality in this part of the river, maintaining what is known as Existing Water Quality (EWQ) at 85 monitoring locations. This program sets strict wastewater discharge limits and includes regular monitoring to track water quality over time.
The trend for the non-tidal Delaware River above Trenton suggests that DO is stable at relatively high DO saturation. It is expected that good DO levels in the non-tidal Delaware River will persist under current SPW regulations.
In the Delaware Estuary, the tidal Delaware River (south of Trenton, N.J.) and the Delaware Bay, DO levels were historically problematic. However, over the past 50+years, the DRBC has addressed the worst of the Estuary's DO problems.
Check out this animated graphic showing summer (July and August) DO improvement from the late 1960's through 2024
Please note: In the graphic, the criteria line is 24-hour mean DO,
while the measurements are daytime spot measurements near surface.
DO Levels Today
DO is measured routinely by DRBC, and continuously by the USGS at multiple gaging stations from Trenton to the Delaware Bay. DRBC has various water quality criteria (based on a 24-hour average concentration) for DO based on water quality zone. The lowest criteria is set for the most urbanized portion of the river around Philadelphia, Camden and Wilmington, with higher criteria set for the upper tidewaters and Delaware Bay.
Significant improvement has been seen since the early-mid 1900s, and current conditions almost always meet criteria. But, there are, at times, mid-summer DO sags near Philadelphia's Ben Franklin Bridge and Chester, Pa. This is a concern for aquatic life, including juvenile fish species native to the estuary (for example, the Atlantic sturgeon). At these depressed oxygen levels, studies have shown that mortality can occur.
- View near real-time dissolved oxygen water quality data
- Restoring Water Quality in the Main Stem Delaware River: Programs, Policies and Strategies (archived PDF; September 2021)
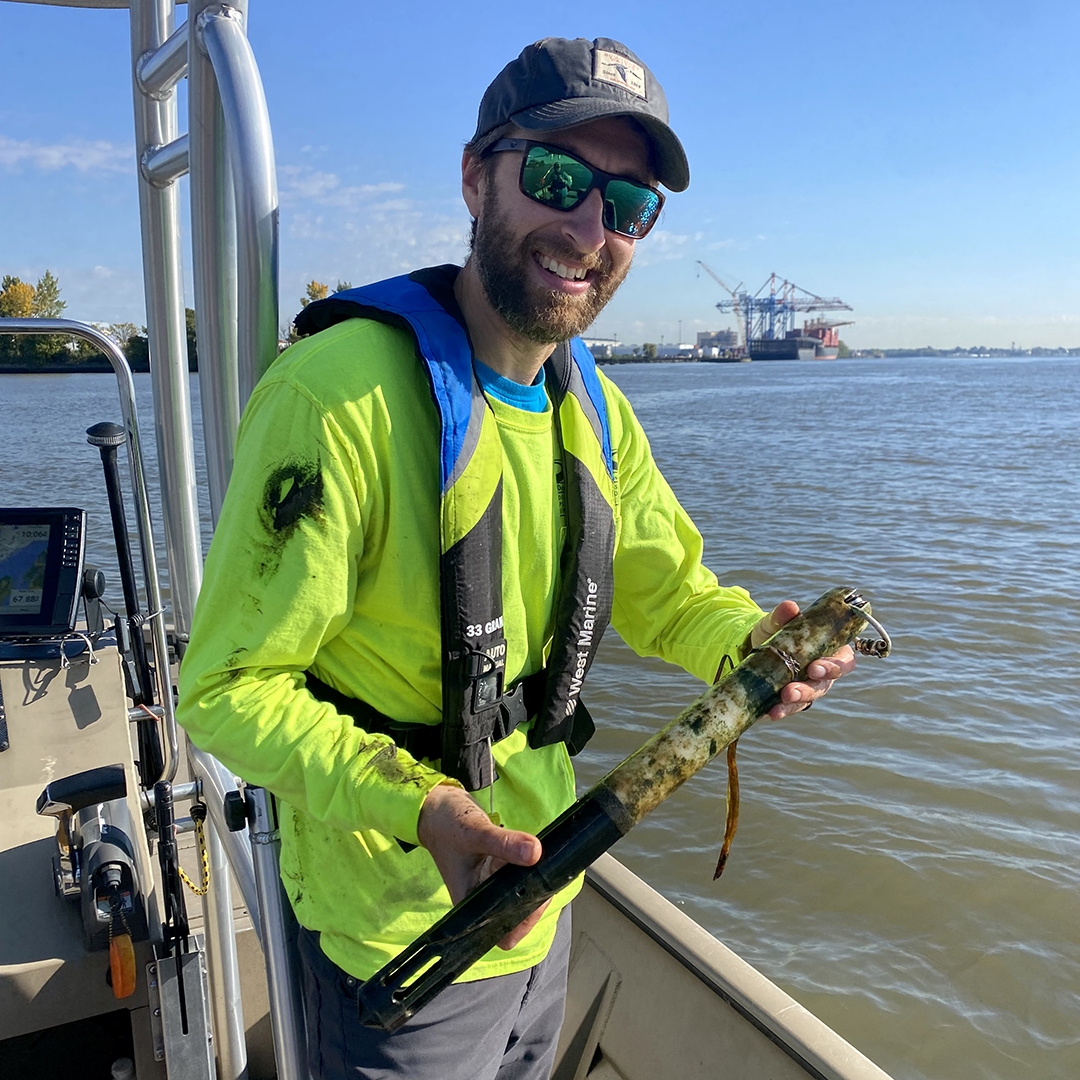 |
| In October 2024, DRBC staff retrieved the DO loggers deployed in the Delaware Estuary for the Sturgeon Spawning Study. Photo by the DRBC. |
Current DRBC Studies
Revising DO Criteria to Better Protect Fish Populations
• See DRBC Aquatic Life Designated Use Project
Sturgeon Spawning DO Study: June - September
In 2022, the DRBC initiated a study of dissolved oxygen (DO) trends in areas considered nursery grounds for juvenile endangered Atlantic sturgeon. The study targets low flow periods, typically the summer months of June - September, when DO levels are lowest. The study began in 2022 and was repeated in 2023 and 2024.
• DO loggers were deployed at Chester, Pa., Marcus Hook and Fox Point Park.
• DO levels at the top and bottom were sampled.
• This data complements the DO data currently being collected at the Ben Franklin Bridge.
The DRBC is also studying:
- How lower DO levels are connected to elevated nutrient levels (called "eutrophication") in the Delaware Estuary
- How DO varies at different depths (i.e., stratification) in the Delaware Estuary
- How various inputs of carbon - from phytoplankton to atmospheric deposition to tidal marshes - impact DO levels
- View Presentation: Carbon Sources and Impacts in the Delaware River Estuary (archived PDF; June 2026)
- View Presentation: Carbon Sources and Impacts in the Delaware River Estuary (archived PDF; June 2026)
- How increasing temperatures and sea level rise will affect Estuary DO levels
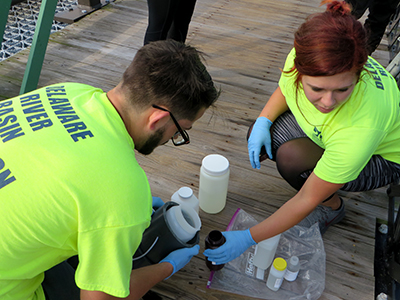 |
| DRBC staff collect water samples to monitor nutrient levels. Photo by the DRBC. |
What are Nutrients?
• Any substance assimilated by living things that promotes growth
• Various chemical forms of nitrogen, phosphorous and carbon; silica and iron are trace nutrients
High Nutrients = Low DO
• Nutrients are good at certain levels
• High concentrations in aquatic ecosystems is known as eutrophication - overstimulates the production of plants and algae, which use DO as they decompose.
• Eutrophication overstimulates the production of plants and algae, which use DO as they decompose, reducing oxygen levels in the water
• Less oxygen in the water leads to reduced water quality, harming fish, wildlife and human health
Where do Excess Nutrients Come From?
- Excess levels of nitrogen and phosphorus enters waterways from fertilizers, animal waste, septic systems, storm runoff and sewage treatment plants.
- This type of pollution is reported to be a problem in more than half of the water bodies in the nation, including waterbodies in the Delaware River Basin.
 |
| DRBC staff preserve a water sample collected to monitor nutrient levels. Photo by the DRBC. |
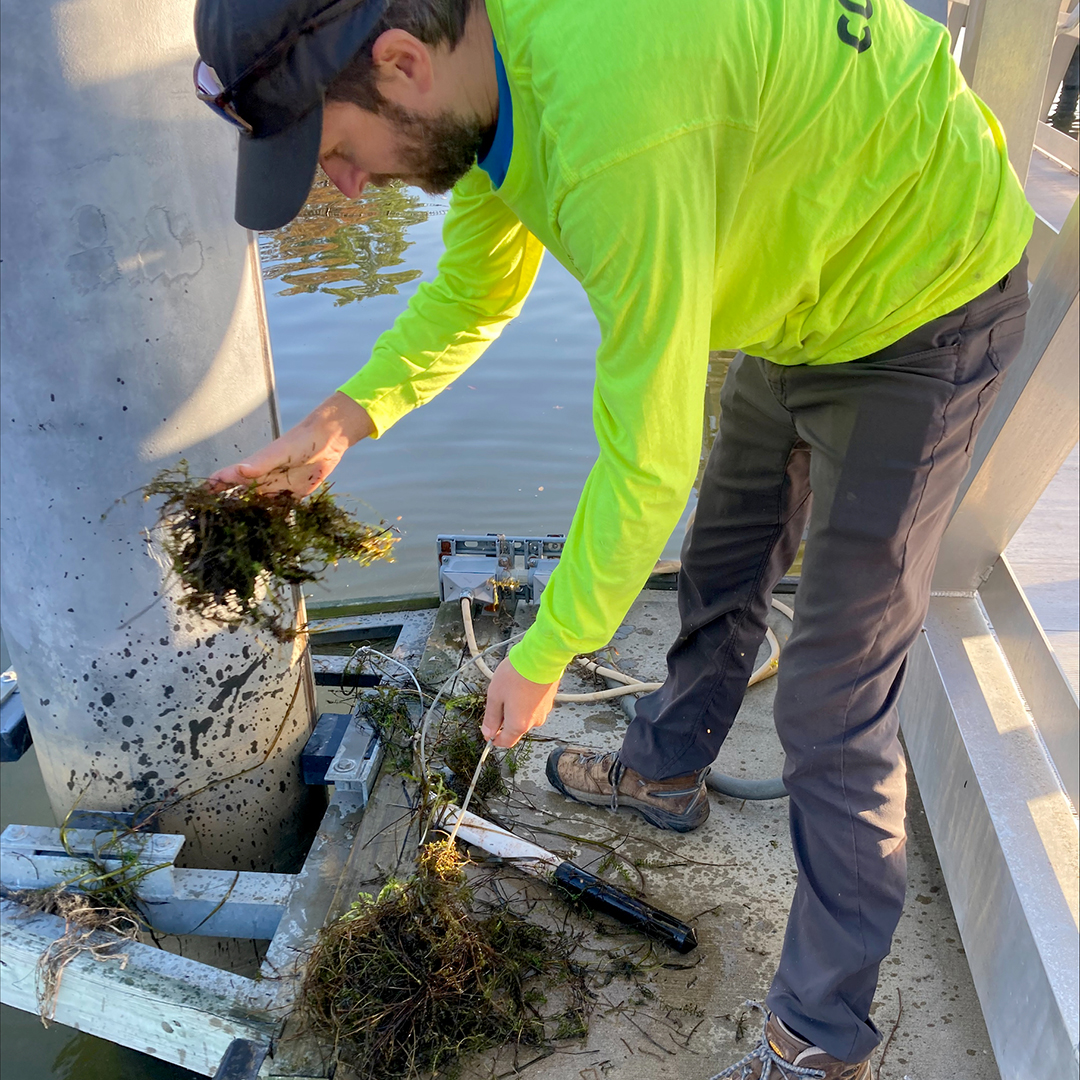 |
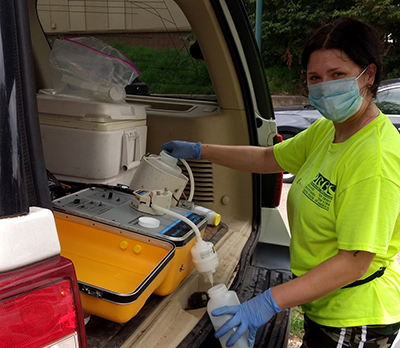
| DRBC staff retrieves the fluorometer at Bristol, Pa. after deployment. Photo by the DRBC. |
Non-Tidal Delaware River
The DRBC's SPW program is designed to prevent degradation of water quality where Existing Water Quality is better than the established water quality standards – essentially, to "keep the clean water clean". This is achieved through management and control of wastewater discharges and strict reporting requirements.
SPW regulations define EWQ concentrations of several nutrients including total nitrogen, ammonia, nitrate, total Kjeldahl nitrogen, total phosphorus and orthophosphate at 85 mainstem Delaware River and tributary sampling locations.
Nutrient concentrations (especially for nitrate and orthophosphate) tend to be lower in the upper portion of the Basin, and, over time, appear to be stable with some improvements, thanks to the effectiveness of the SPW program.
Delaware River Estuary
The Delaware River Estuary - especially around its urban cities of Philadelphia, Camden and Wilmington - has both high loadings and high concentrations of nutrients relative to other large estuaries such as Chesapeake Bay. Despite this, the Delaware Estuary exhibits few symptoms of eutrophication due mainly to light limitation and energetic currents.
However, as mentioned in the above section on DO, along Philadelphia's urban river corridor, an area of reduced dissolved oxygen persists at certain times of the year.
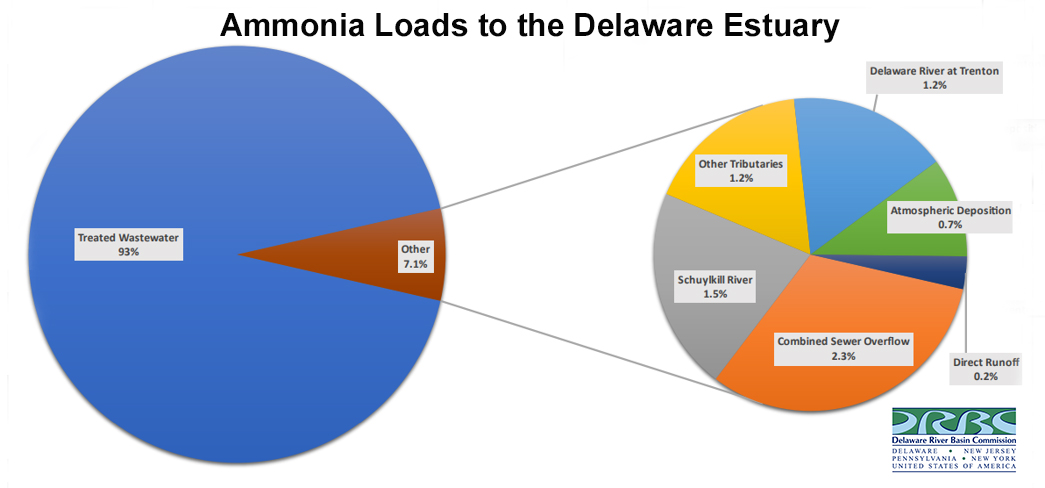
A recently developed eutrophication model suggests that most of this dissolved oxygen sag comes from elevated ammonia loads from wastewater from sewage treatment plants. In fact, 93% of the ammonia loads to the Estuary come from treated wastewater. Reductions in these ammonia loadings are needed to improve dissolved oxygen in the Estuary.
• Graphic showing Ammonia Loadings to the Delaware River Estuary (JPG)
DRBC's main focus is to identify appropriate levels of nutrients and the necessary measures to take in order to improve DO levels in the Delaware Estuary.
Monitoring for Phytoplankton & Various Nutrients
However, the eutrophication model did suggest that observed phytoplankton blooms in the estuary around Philadelphia may be caused by transient micro-blooms just upstream that propagate and magnify downstream. Phytoplankton blooms are caused by excess nutrients and can lower DO in the river.
- In 2024, the DRBC conducted a study to obtain additional field data to help explain observed phytoplankton blooms on finer geographic and temporal scales than existing monitoring regimes provide. Continuous fluorometers were deployed from April to October at three locations: Schuylkill River at Fairmount Dam; Delaware River at Bristol Wharf; and Delaware River at Chester, Pa. During deployment, staff collected surface water samples weekly or bi-weekly. Chlorophyll-a and algal samples were collected to identify density and composition, with analytical work conducted by the Academy of Natural Sciences Drexel University. Initial results show most phytoplankton activity at the Schuylkill River site.
- Starting in 2025, the DRBC is working with the N.J. Department of Environmental Protection (NJDEP) to collect nutrient samples from 4 N.J. tidal tributaries: Blacks and Crosswicks creeks (sampled as one system), Pennsauken Creek, Rancocas Creek and Raccoon Creek. This monitoring effort is targeting tributaries with point-source discharges (NPDES permit holders) and known water quality impairment to get a better understanding of numerical nutrient concentrations in these waterways. The nutrient grab samples are collected every other week. Sondes are also deployed to collect dissolved oxygen, temperature, pH, specific conductance and turbidity data. This project is planned to continue through 2028.
Links to Learn More
- DRBC Water Quality Advisory Committee
- DRBC Aquatic Life Designated Use Project
- DRBC Special Protection Waters
- DRBC Biomonitoring Program
Archived Reports
- Report to DRBC on Concentrations of Nutrients and Chlorophyll-a and Rates of Respiration and Primary Production in Samples from the Delaware River Collected in May and July 2019 (PDF; submitted to DRBC by the Horn Point Laboratory, University of Maryland; revised Sept. 2020)
- Report to DRBC on Concentrations of Nutrients and Chlorophyll-a and Rates of Respiration and Primary Production in Samples from Delaware River Collected in May and July 2018 (PDF; submitted to DRBC by the Horn Point Lab/UMd., Feb. 2019)
- Report to DRBC on Concentrations of Nutrients and Chlorophyll-a and Rates of Respiration and Primary Production in Samples from Delaware Bay Collected in May and July 2014 (PDF; submitted to DRBC by the Horn Point Lab/UMd.; rev. Jan. 2019)
- Impact of Treatment Type on Municipal Wastewater Treatment Effluent Nutrient Concentrations in the Delaware River Basin (PDF; July 2016)
- Point Discharge Effluent Nutrient Concentrations in the Delaware River Basin: A Preliminary Review (PDF; May 2014)
- Delaware River and Delaware Estuary Nutrient Criteria Plan (PDF; December 2013)