Delaware • New Jersey • Pennsylvania
New York • United States of America
 In August 2016, the DRBC released its report entitled Lower Delaware River Special Protection Waters Assessment of Measurable Changes to Existing Water Quality, Round 1: Baseline EWQ (2000-2004) vs. Post-EWQ (2009-2011).
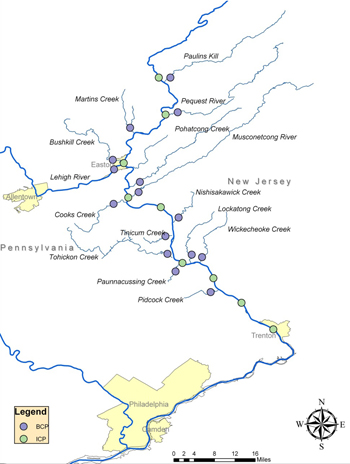
The report, which compares water quality data initially collected from 2000-2004 to the assessment period of 2009-2011, evaluated data collected at nine interstate control points (ICP) located on the main stem Lower Delaware River and at 15 boundary control points (BCP) located on tributaries in a 76-mile stretch of river from Portland, Pa. to Trenton, N.J. The map to the left shows ICP and BCP locations.
The purpose of the report was to determine whether changes to existing water quality in this section of river have occurred. For most water quality parameters at most locations, there were no measurable changes to existing water quality. These results demonstrate that DRBC’s Special Protection Waters (SPW) program is working and plays an important role in managing water quality in the Delaware River Basin.
The SPW program covers the entire 197-mile non-tidal Delaware River from Hancock, N.Y. to Trenton, N.J. The regulations state that there will be no measurable change in existing water quality of SPW waters except towards natural conditions. This is accomplished by taking a watershed approach, looking at the drainage area of the designated waters and considering cumulative impacts of discharges. Monitoring is required to determine if measurable change is occurring at designated interstate and boundary control points where existing water quality has been defined. Learn more about SPW via the link on the right.
This interactive map will allow you to view the 24 sites included in the assessment report. The nine tabs along the top of the page are labeled by control point designation and descriptive name (the tab on the far right-hand side allows you to access the additional 15 sites). Each tab will direct you to a localized map, where you can click on orange or purple dot corresponding to the specific control point location on the map to view the assessment report for that particular site or click on a shaded watershed on the map for population and land use summary information.
Lower Delaware River Special Protection Waters Assessment of Measurable Changes to Existing Water Quality, Round 1: Baseline EWQ (2000-2004) vs. Post-EWQ (2009-2011) (Full report, includes bookmarks; pdf 72 MB)
Report Chapters:
- Executive Summary: Includes Introduction and Summary Matrix of Water Quality Changes (pdf 949 KB)
- Chapter 1: ICP - Delaware River at Trenton (NJ)/Morrisville (PA) (pdf 3.8 MB)
- Chapter 2: ICP - Delaware River at Washington Crossing (NJ/PA) (pdf 3.9 MB)
- Chapter 3: BCP - Pidcock Creek, Bucks County (PA) (pdf 3.4 MB)
- Chapter 4: ICP - Delaware River at Lambertville (NJ)/New Hope (PA) (pdf 1 MB)
- Chapter 5: BCP - Wickecheoke Creek, Hunterdon County (NJ) (pdf 3.6 MB)
- Chapter 6: BCP - Lockatong Creek, Hunterdon County (NJ) (pdf 1.1 MB)
- Chapter 7: ICP - Delaware River at Bulls Island Foot Bridge (NJ/PA) (pdf 3.6 MB)
- Chapter 8: BCP - Paunacussing Creek, Bucks County (PA) (pdf 1.1 MB)
- Chapter 9: BCP - Tohickon Creek, Bucks County (PA) (pdf 1.2 MB)
- Chapter 10: BCP - Tinicum Creek, Bucks County (PA) (pdf 1.1 MB)
- Chapter 11: BCP - Nishisakawick Creek, Hunterdon County (NJ) (pdf 3.8 MB)
- Chapter 12: ICP - Delaware River at Milford (NJ)/Upper Black Eddy (PA) (pdf 1.1 MB)
- Chapter 13: BCP - Cooks Creek, Bucks and Northampton Counties (PA) (pdf 4.1 MB)
- Chapter 14: BCP - Musconetcong River, Multiple Counties (NJ) (pdf 4.3 MB)
- Chapter 15: ICP - Delaware River at Riegelsville (NJ/PA) (pdf 1.1 MB)
- Chapter 16: BCP - Pohatcong Creek, Warren County (NJ) (pdf 1.1 MB)
- Chapter 17: BCP - Lehigh River, Multiple Counties (PA) (pdf 4.3 MB)
- Chapter 18: ICP - Delaware River at Easton (PA) (pdf 4 MB)
- Chapter 19: BCP - Bushkill Creek, Northampton County (PA) (pdf 4.2 MB)
- Chapter 20: BCP - Martins Creek, Northampton County (PA) (pdf 4.1 MB)
- Chapter 21: BCP - Pequest River, Warren and Sussex Counties (NJ) (pdf 4.3 MB)
- Chapter 22: ICP - Delaware River at Belvidere (NJ) (pdf 4.2 MB)
- Chapter 23: BCP - Paulins Kill River, Warren and Sussex Counties (NJ) (pdf 1.1 MB)
- Chapter 24: ICP - Delaware River at Portland (PA) (pdf 4 MB)
- Appendix A: New and Recommended Future Sites for Inclusion in DRBC Special Protection Waters Rules (pdf 1.6 MB)
- Appendix B: Statistical Plots Generated by Analyse-It (pdf 620 KB)
- Appendix C: Flow Estimation and Measurement Techniques of the Scenic Rivers Monitoring Program (pdf 508 KB)