 Official Site of The State of New Jersey
2020 Census Data

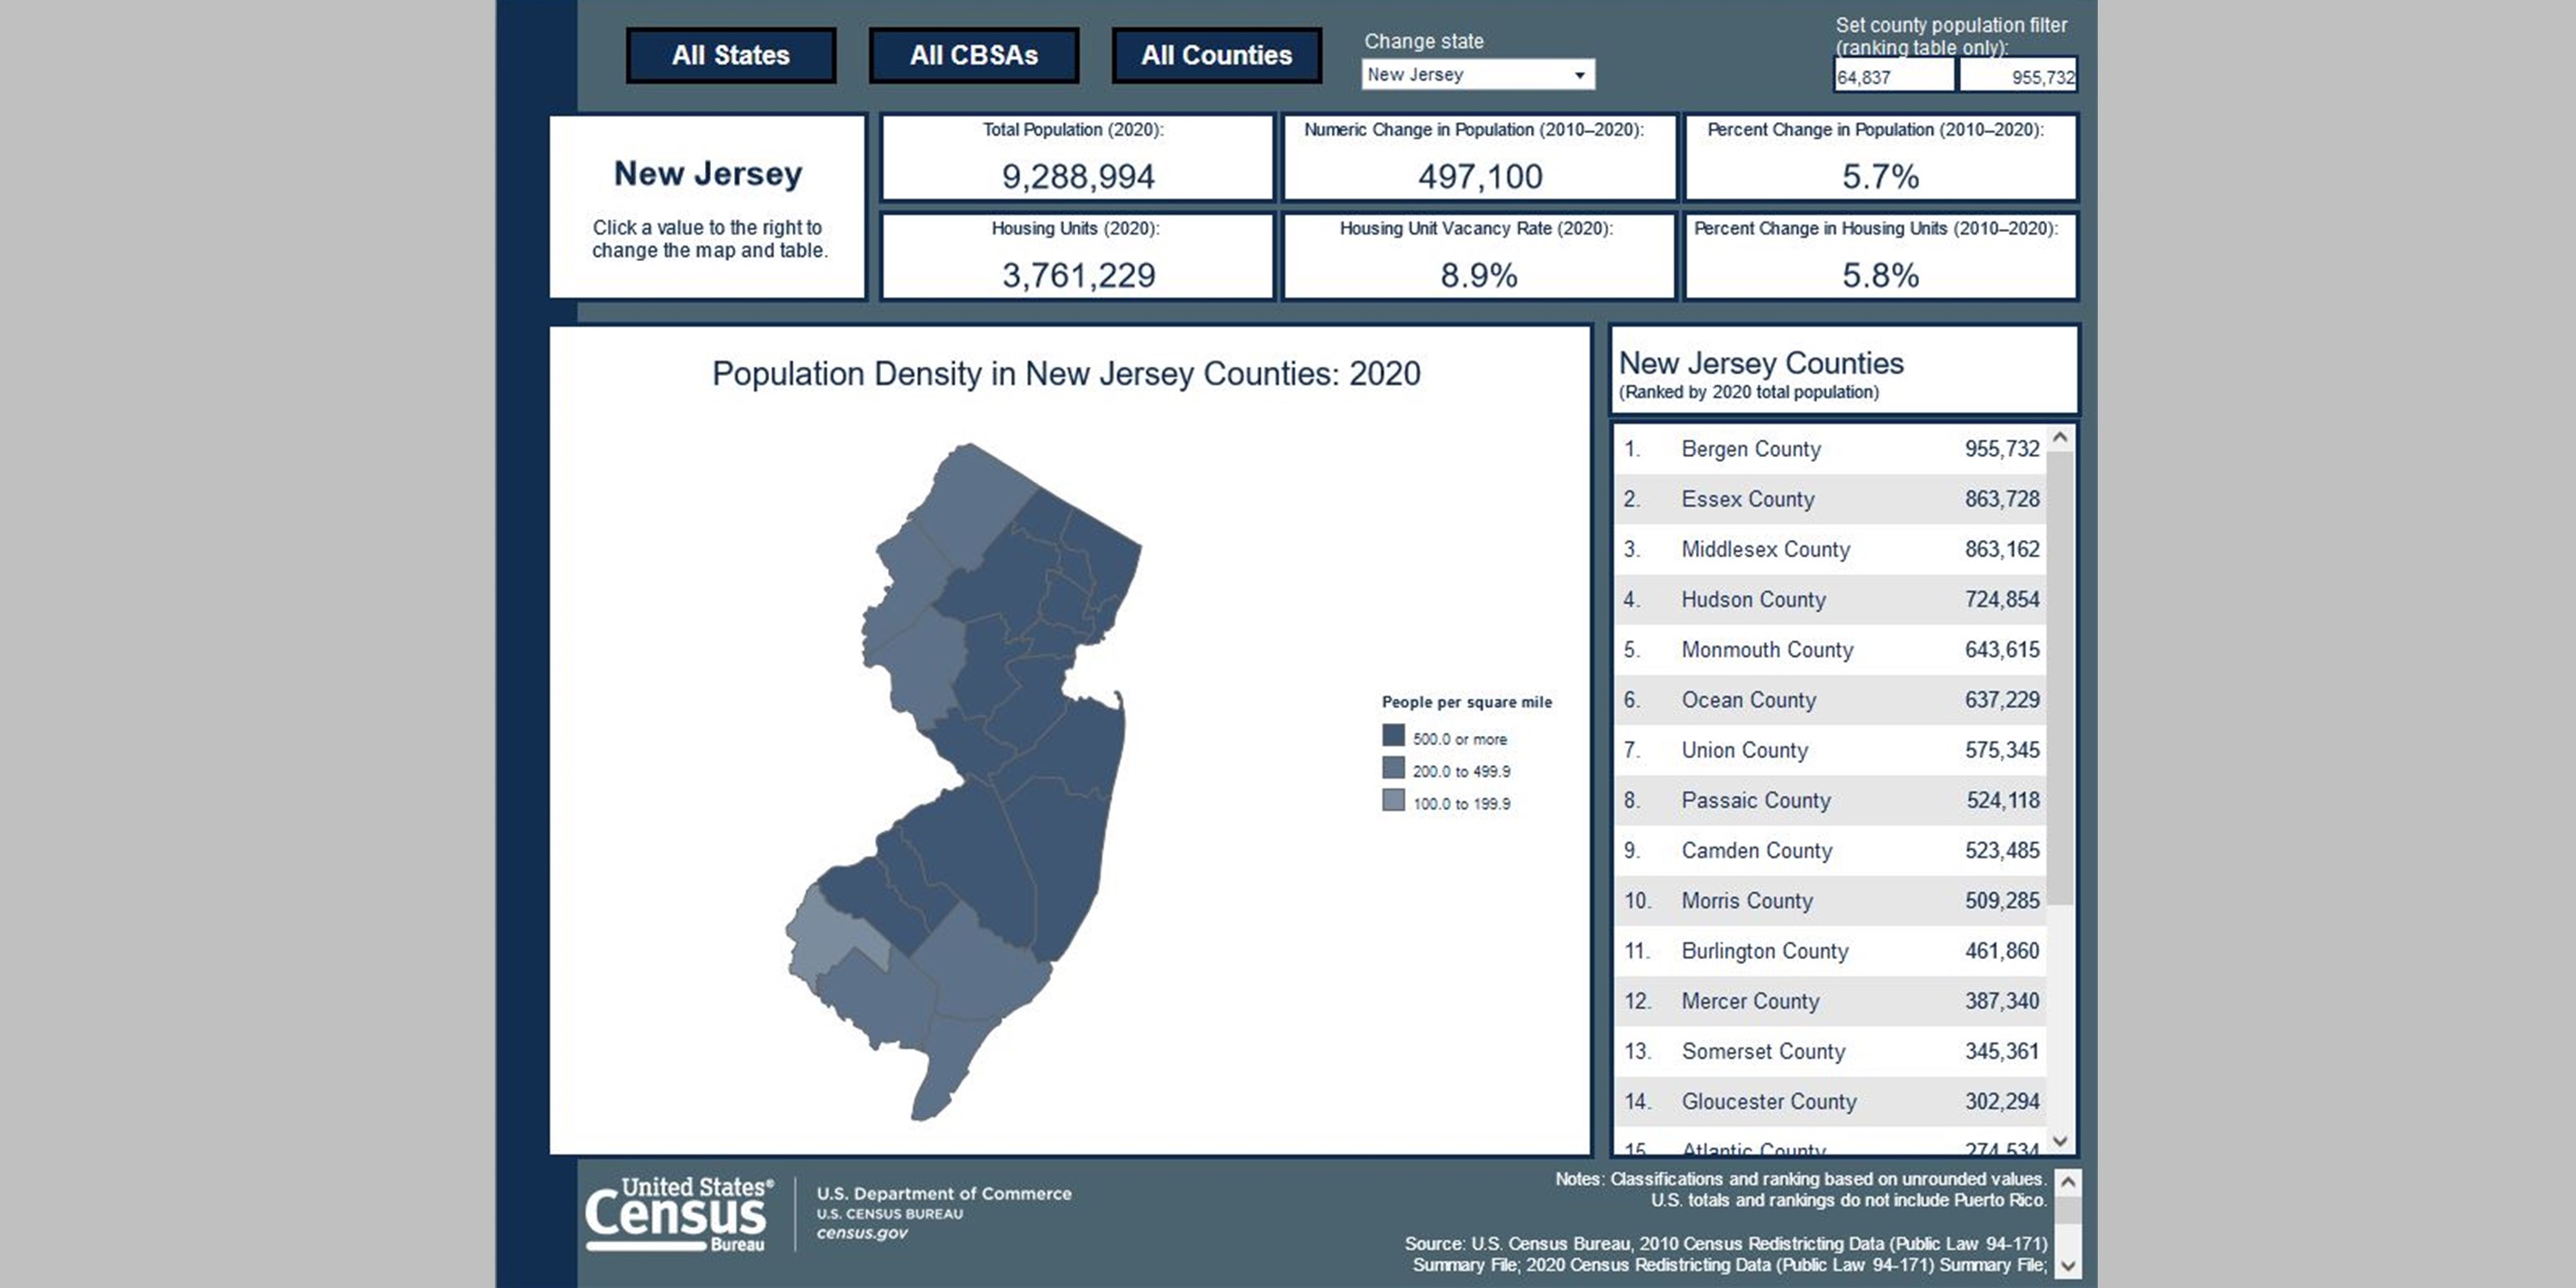
The population of New Jersey on April 1, 2020 was 9,288,994.
This page contains a directory of publications prepared by the New Jersey Department of Labor and Workforce Development using data from the 2020 Census. Topics covered include New Jersey population trends 1790-2020, money income and poverty, population by race, and more.
Hudson County (No CDPs in Hudson)
- Congressional district 1
- Congressional district 2
- Congressional district 3
- Congressional district 4
- Congressional district 5
- Congressional district 6
- Congressional district 7
- Congressional district 8
- Congressional district 9
- Congressional district 10
- Congressional district 11
- Congressional district 12
- State Legislative District 1
- State Legislative District 2
- State Legislative District 3
- State Legislative District 4
- State Legislative District 5
- State Legislative District 6
- State Legislative District 7
- State Legislative District 8
- State Legislative District 9
- State Legislative District 10
- State Legislative District 11
- State Legislative District 12
- State Legislative District 13
- State Legislative District 14
- State Legislative District 15
- State Legislative District 16
- State Legislative District 17
- State Legislative District 18
- State Legislative District 19
- State Legislative District 20
- State Legislative District 21
- State Legislative District 22
- State Legislative District 23
- State Legislative District 24
- State Legislative District 25
- State Legislative District 26
- State Legislative District 27
- State Legislative District 28
- State Legislative District 29
- State Legislative District 30
- State Legislative District 31
- State Legislative District 32
- State Legislative District 33
- State Legislative District 34
- State Legislative District 35
- State Legislative District 36
- State Legislative District 37
- State Legislative District 38
- State Legislative District 39
- State Legislative District 40
Public Law (P.L.) 94-171, enacted by Congress in December 1975, requires the Census Bureau to provide states the opportunity to identify the small area geography for which they need data in order to conduct legislative redistricting. The law also requires the U.S. Census Bureau to furnish tabulations of population to each state, including for those small areas the states have identified, within one year of Census day.
Census Bureau Delivers 2020 Census Redistricting Data in Easier-to-Use Format (US Census Bureau Press Release)
- Table 1: The Counties and Most Populous Cities and Townships in 2020 in New Jersey: 2010 and 2020
- Table 2: Population by Race and Hispanic or Latino Origin, for All Ages and for 18 Years and Over, for New Jersey: 2010 and 2020
- Table 3: Population by Race Alone or in Combination and Hispanic or Latino Origin, for All Ages and for 18 Years and Over, for New Jersey: 2010 and 2020
- Table 4: Population by Race, Including All Specific Combinations of Two Races, for New Jersey: 2020
- Table 5: The Counties and Most Populous Cities and Townships by Race and Hispanic or Latino Origin in New Jersey: 2020
- Tables 1-5
- Population Density by County: 2010 and 2020
- Population Density by Municipality: 2010 and 2020
- Minorities Population in Municipalities: 2020
- County Population Map
- County Percent Change Map
State and county data file:
New Jersey State Population data by age, race, and Hispanic origin:
- All ages (PDF)
- 18 and over (PDF)
- 17 and under (PDF)
- All tables (PDF)
- All tables (Excel)
2020 Census Data for New Jersey Census Designated Places:
2020 Census Data for New Jersey School Districts in Excel format:
County and Municipal Data for New Jersey Counties (in Excel format):
Population by Age, Race, and Hispanic or Latino Origin for New Jersey Counties: 2010 and 2020:
Population by Race and Hispanic or Latino Origin for New Jersey Counties (2010 and 2020):
|
Note: Individual Race Alone table percentages stated as a percentage of Total Population. 2010 Census counts as published in 2010 Census reports and thus do not include changes published subsequently due to boundary changes or to the Count Questionnaire Resolution program. |
|
Population by Race and Hispanic or Latino Origin, Population Over and Under 18 Years of Age for New Jersey Counties (2010 and 2020):
|
|
|
|
Note: 2010 Census counts as published in 2010 census reports and thus do not include changes published subsequently due to boundary changes or to the Count Questionnaire Resolution program. |
|
Population by Age, Race, and Hispanic or Latino Origin for New Jersey Counties (2010 and 2020):
Population by Race and Hispanic or Latino Origin for New Jersey Municipalities (2010 and 2020):
|
Note: 2010 Census counts as published in 2010 census reports and thus do not include changes published subsequently due to boundary changes or to the Count Questionnaire Resolution program. |
|
Total Population and Population Over and Under 18 Years of Age for New Jersey Municipalities (2010 and 2020):
| Note: 2010 Census counts as published in 2010 census reports and thus do not include changes published subsequently due to boundary changes or to the Count Questionnaire Resolution program. | |
Click here to watch a brief video on apportionment.
Click here to view the Historical Apportionment Data Map.
Table 1. Apportionment Population and Number of Representatives by State: 2020 Census:
Table 2. Resident Population for the 50 States, the District of Columbia, and Puerto Rico: 2020 Census:
Table 3. Overseas Population for the 50 States and the District of Columbia: 2020 Census:
Table A. Apportionment Population, Resident Population, and Overseas Population: 2020 Census and 2010 Census:
Table B1. Top Ten Runner-Up States to Almost Gain Another Congressional Seat: 2020 Census
Table B2. Additional Apportionment Population Needed for First Runner-Up State to Gain Another Congressional Seat: 1940 to 2020:
Table C1. Number of Seats in U.S. House of Representatives by State: 1910 to 2020:
Table C2. Apportionment Population and Number of Seats in U.S. House of Representatives by State: 1910 to 2020:
Table D1. Number of Seats Gained and Lost in U.S. House of Representatives by State: 2020 Census
Table D2. Number of Seats Gained and Lost in U.S. House of Representatives by State: 2010 Census:
Table E. Numeric and Percent Change in Resident Population of the 50 States, the District of Columbia, and Puerto Rico: 2020 Census and 2010 Census:
Number of U.S Military Personnel, Federal Civilian Personnel, and their Dependents in the Overseas Population for the 50 States and the District of Columbia: 2020 Census:
Priority Values for 2020 Census Apportionment:

See how the total population and race and ethnicity groups have changed over time in New Jersey.
Explore “Population and Housing,” “Race and Ethnicity”, “Diversity,” and “Age” data from the 2020 Census.
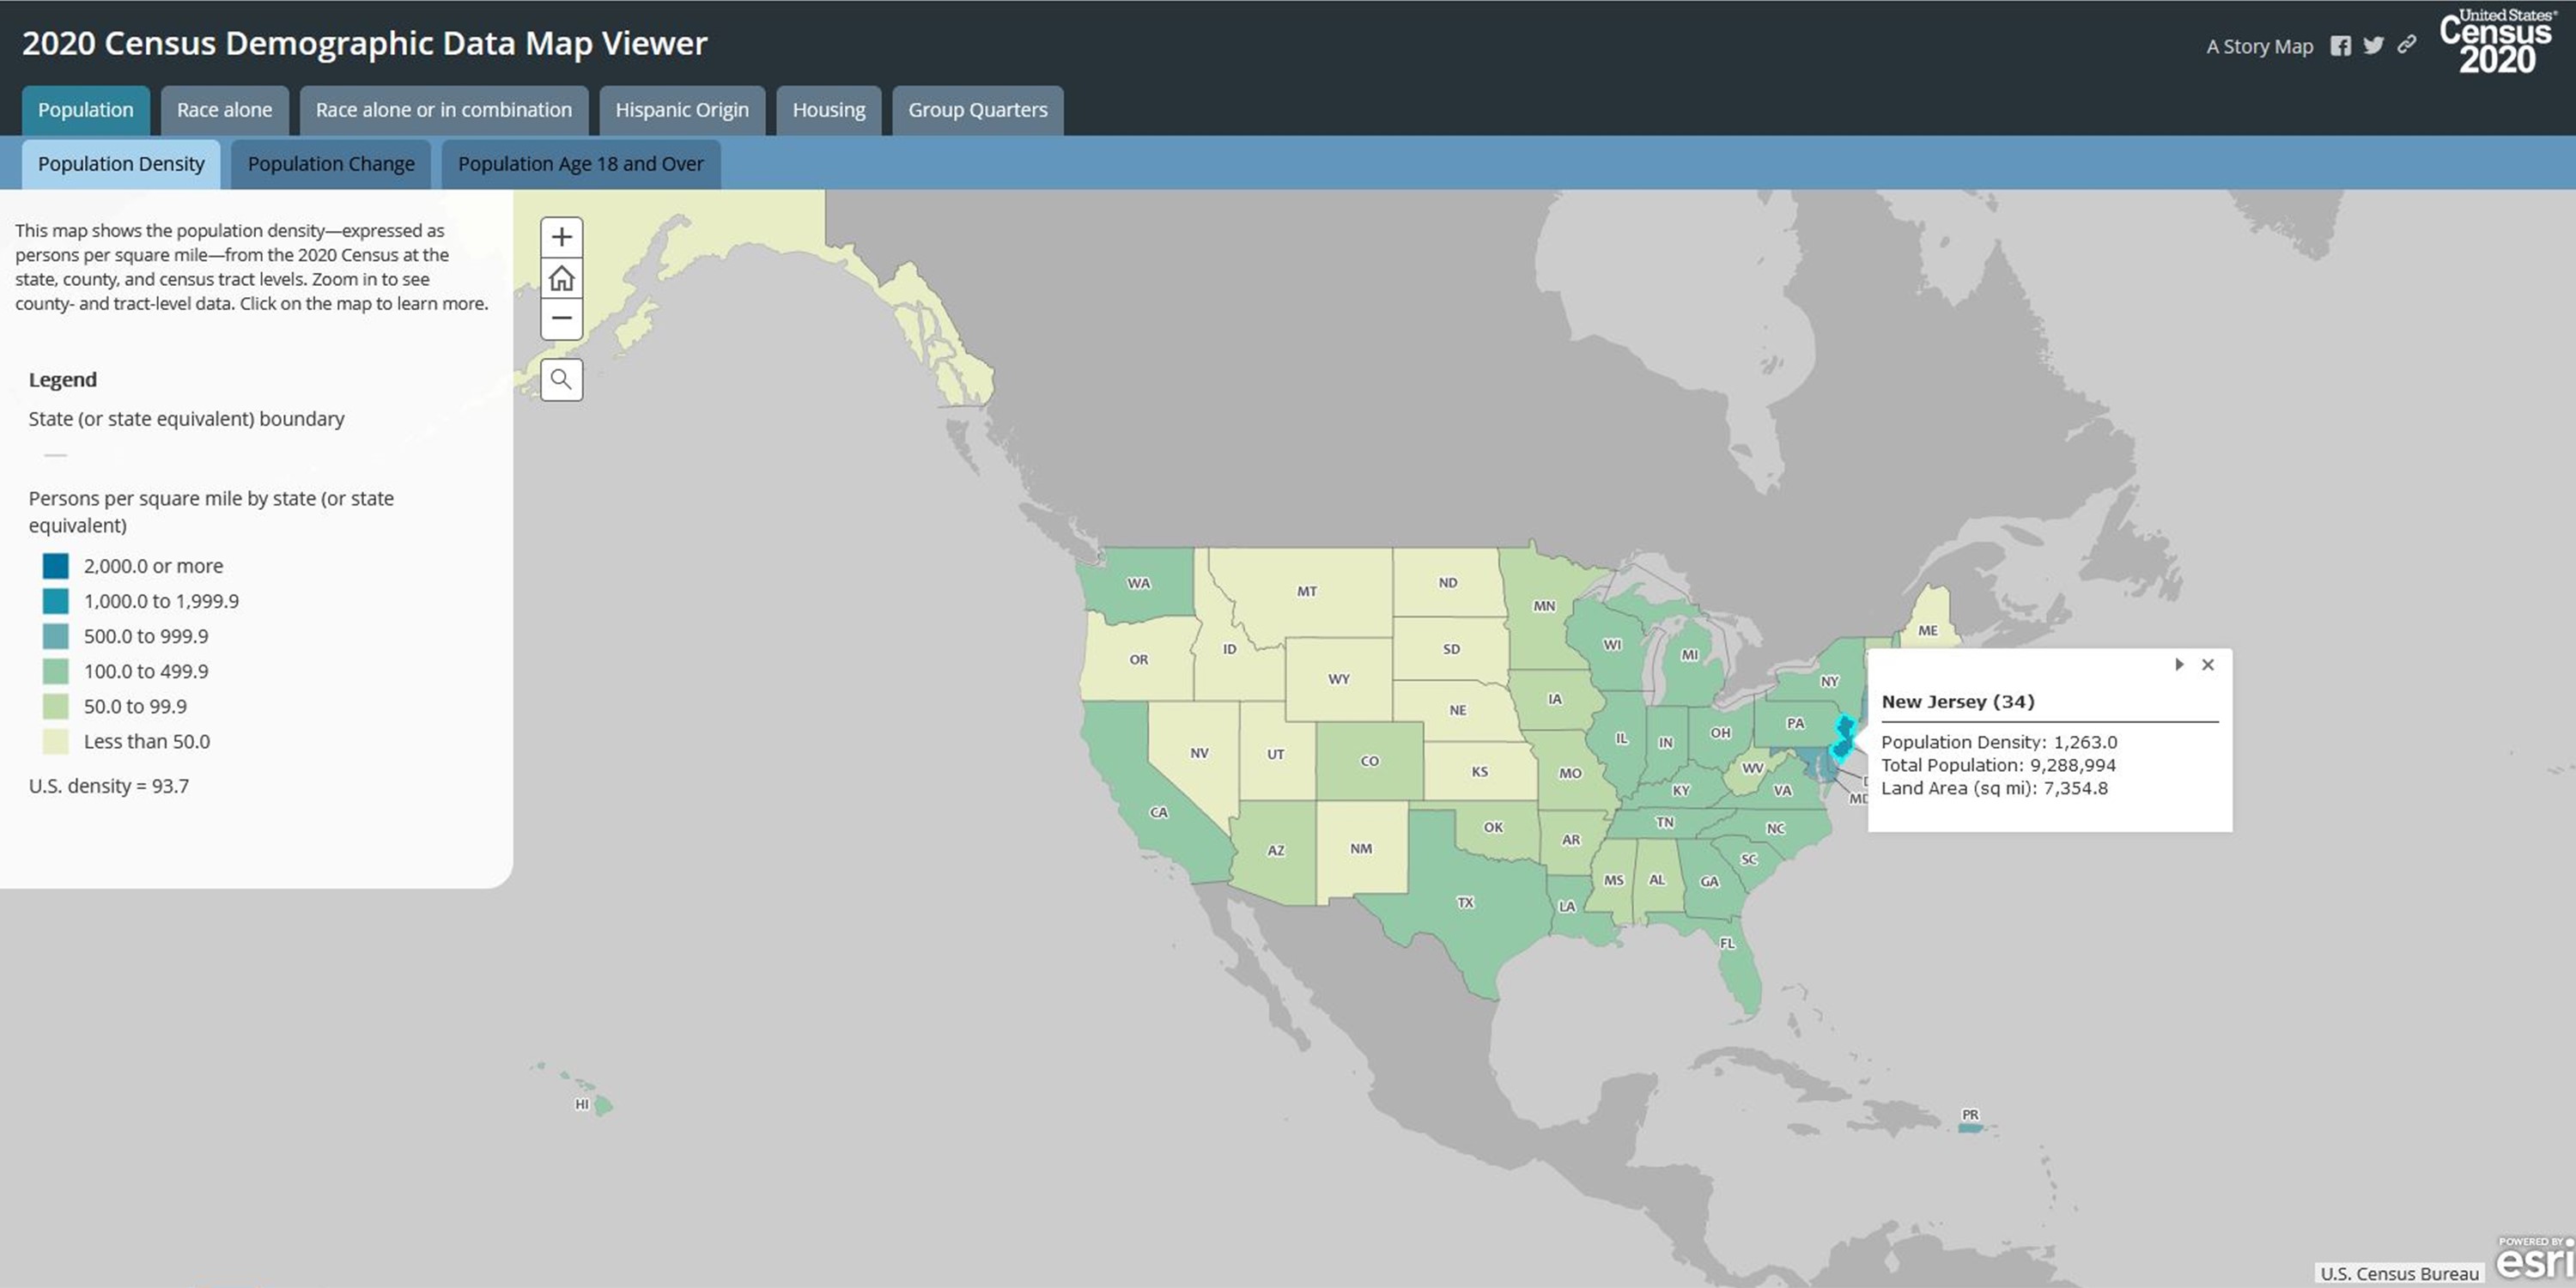
Discover state-, county-, and census tract-level data from the 2020 Census.
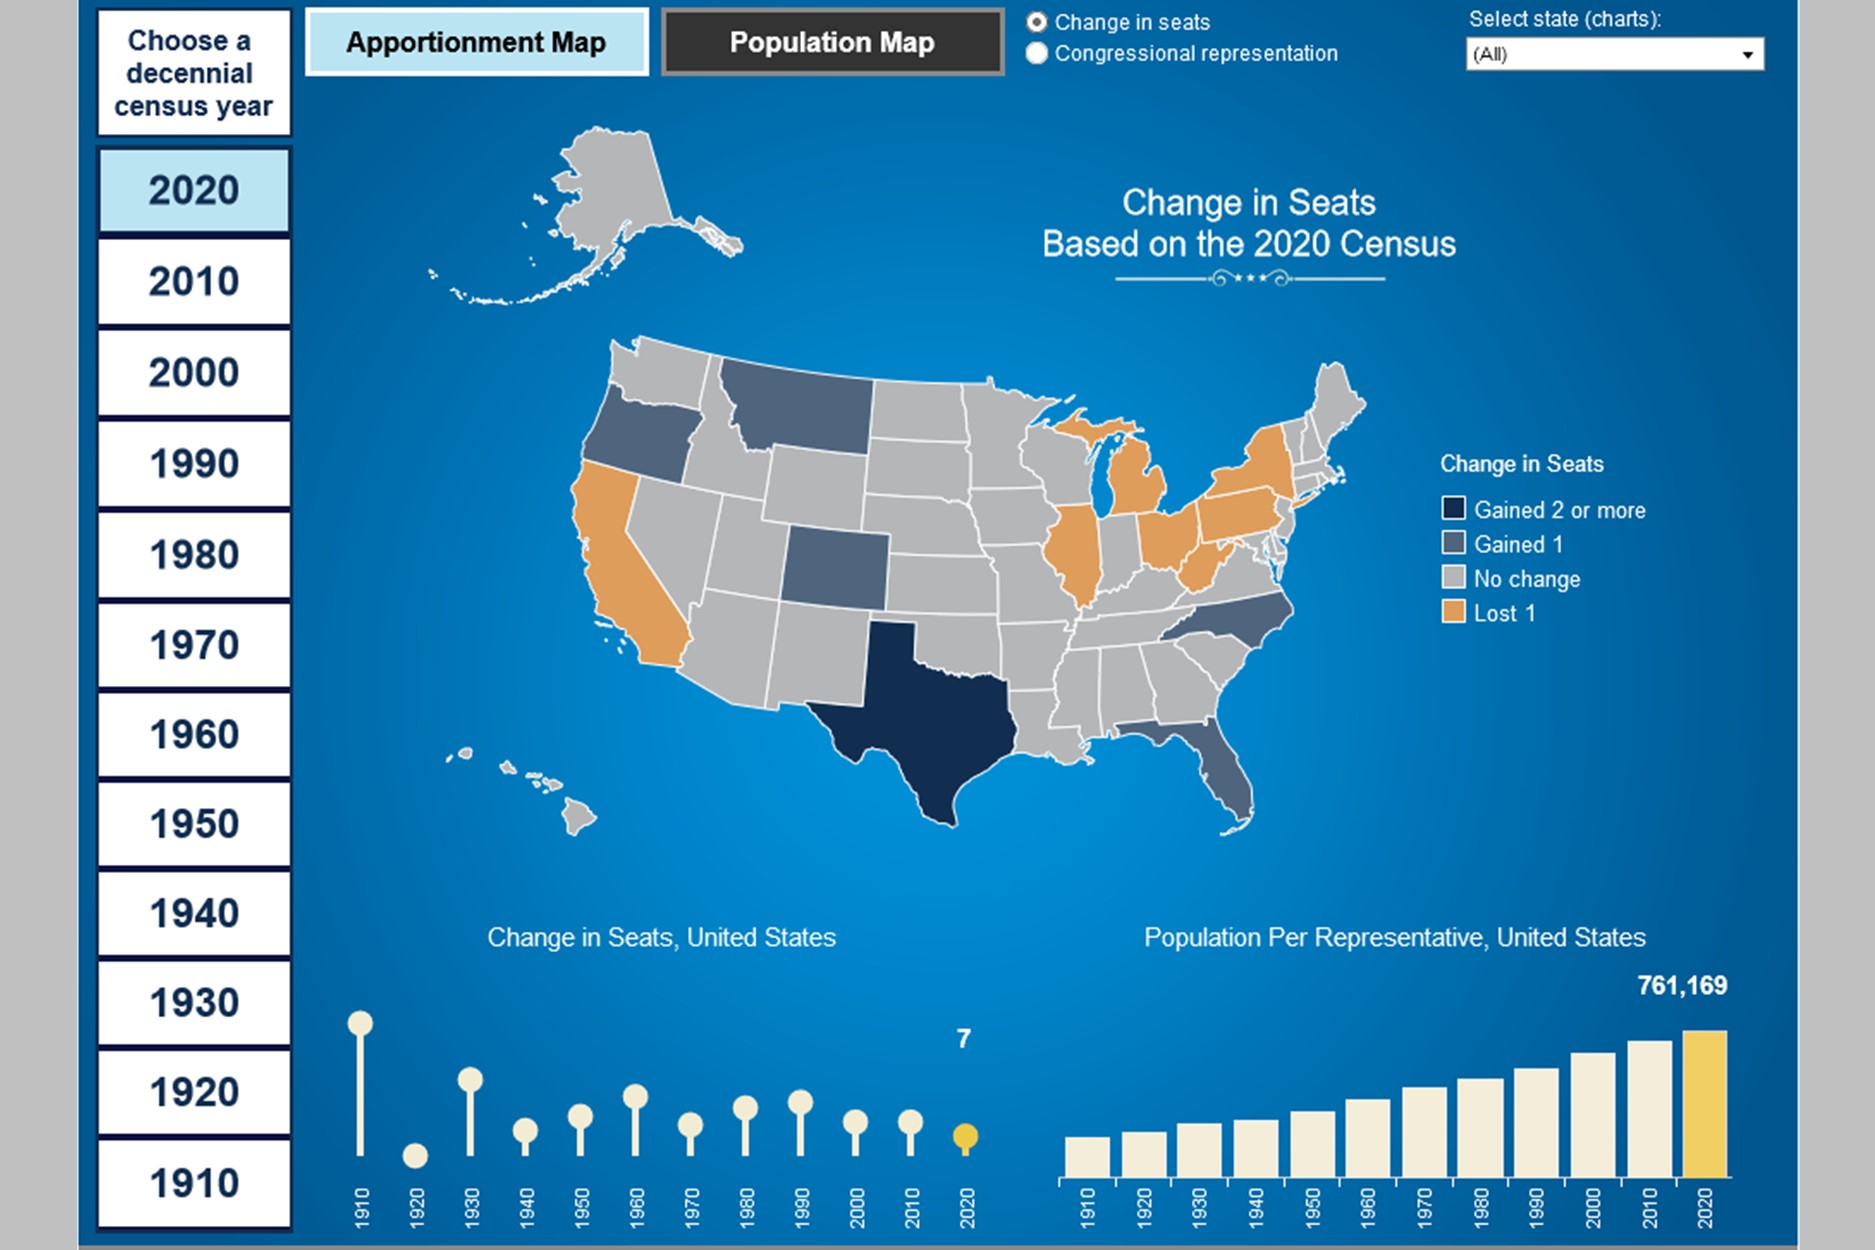
Use this interactive tool to view more than 10 decades of apportionment and population data.
Explore the latest American Community Survey (ACS) data with this interactive tool.