 Official Site of The State of New Jersey
Income and Poverty

This page contains estimates of personal income from the U.S. Bureau of Economic Analysis (BEA) and money income and poverty from the U.S. Bureau of the Census.
Unlike the 2000 Census, the 2010 Census was conducted using only the short form. Because the long form was discontinued, the Summary File 3 (SF 3) data set is not available for the 2010 Census. Much of the social, economic and housing characteristics data formerly obtained through the SF 3 is now available through the American Community Survey (ACS), which is conducted by the US Census Bureau on an annual basis. Although the American Community Survey is produced on a more timely basis than the decennial census, the sample size is smaller which reduces reliability and increases the margin of error. Whereas the long form was mailed to approximately one in six households during the 2000 Census, the ACS is mailed annually to about one in 39 households.
Although one-year ACS estimates are the most current, they are the least reliable. Because the Census Bureau only publishes data in the one- and three-year series that meet minimum reliability standards, not all data is available at the county or municipal levels for these series. The one-year series is available for areas with populations over 60,000. To increase reliability and permit the publication of more data, the Census Bureau also produces three-year and five-year ACS series which combine several years of responses. The three-year series is published for areas with populations over 20,000. The five-year series is published for all levels of geography.
The one-year series, three-year series and five-year series are not comparable with each other. Thus, when comparing different levels of geography such as the state, counties and municipalities, the series that accommodates the area with the lowest population should be used to analyze all the areas examined. The income data presented below is provided at the one-year, three-year and five-year levels for the state and counties. Municipal data is only provided at the five-year level.
Income by Race and Hispanic Origin
- Median Household Income by Race and Hispanic Origin of Householder:
- Median Family Income by Race and Hispanic Origin of Householder:
- Per Capita Income by Race:
Income for ALL Persons
Household, Family Income, Nonfamily Income Distributions for New Jersey and Counties: 2010 (1-year ACS estimates)
|
|
|
|
Household, Family Income, Nonfamily Income Distributions for New Jersey and Counties: 2010 (1-year ACS estimates - Excel format)
Income by Race and Hispanic Origin
- Median Household Income by Race and Hispanic Origin of Householder:
- Median Family Income by Race and Hispanic Origin of Householder:
- Per Capita Income by Race:
Income for ALL Persons
Household, Family Income, Nonfamily Income Distributions for New Jersey and Counties: 2010 (3-year ACS estimates)
|
|
|
|
Household, Family Income, Nonfamily Income Distributions for New Jersey and Counties: 2010 (3-year ACS estimates - Excel format)
Income by Race and Hispanic Origin
- Median Household Income by Race and Hispanic Origin of Householder:
- Median Family Income by Race and Hispanic Origin of Householder:
- Per Capita Income by Race:
Income for ALL Persons
Household, Family Income, Nonfamily Income Distributions for New Jersey and Counties: 2010 (5-year ACS estimates)
|
|
|
|
Household, Family Income, Nonfamily Income Distributions for New Jersey and Counties: 2010 (5-year ACS estimates - Excel format)
Income for All Persons
- Household Income in the Past 12 Months (in 2010 inflation-adjusted dollars) by County, Municipality and Legislative District: New Jersey, 2006-2010.
- Family Income in the Past 12 Months (in 2010 inflation-adjusted dollars) by County, Municipality and Legislative District: New Jersey, 2006-2010.
- Nonfamily Household Income in the Past 12 Months (in 2010 inflation-adjusted dollars) by County, Municipality and Legislative District: New Jersey, 2006-2010.
- Median Household, Family and Per Capita Income by Race and Hispanic Origin: State, County and Municipality, 2006-2010.(Excel Format)
Median Household, Family, Nonfamily, Per-Capita Income & Per Capita Income Rank by Municipality; 2010. (5-year ACS Estimates)
For detailed information on appropriate data usage and ACS methodology, please consult the General Data Users Handbook, also published by the US Census Bureau.
Unlike the 2000 Census, the 2010 Census was conducted using only the short form. Because the long form was discontinued, the Summary File 3 (SF 3) data set is not available for the 2010 Census. Much of the social, economic and housing characteristics data formerly obtained through the SF 3 is now available through the American Community Survey (ACS), which is conducted by the US Census Bureau on an annual basis. Although the American Community Survey is produced on a more timely basis than the decennial census, the sample size is smaller which reduces reliability and increases the margin of error. Whereas the long form was mailed to approximately one in six households during the 2000 Census, the ACS is mailed annually to about one in 39 households.
Although one-year ACS estimates are the most current, they are the least reliable. Because the Census Bureau only publishes data in the one- and three-year series that meet minimum reliability standards, not all data is available at the county or municipal levels for these series. The one-year series is available for areas with populations over 60,000. To increase reliability and permit the publication of more data, the Census Bureau also produces three-year and five-year ACS series which combine several years of responses. The three-year series is published for areas with populations over 20,000. The five-year series is published for all levels of geography.
The one-year series, three-year series and five-year series are not comparable with each other. Thus, when comparing different levels of geography such as the state, counties and municipalities, the series that accommodates the area with the lowest population should be used to analyze all the areas examined. The income data presented below is provided at the one-year, three-year and five-year levels for the state and counties. Municipal data is only provided at the five-year level.
Poverty Status for ALL Persons
- Poverty Status in the Past 12 Months by Age by County, Municipality and Legislative District: New Jersey, 2006-2010
- Poverty Status by Age in the Past 12 Months: New Jersey and Counties
- Poverty Status by Age and Sex in the Past 12 Months: New Jersey and Counties
- Poverty Status in the Past 12 Months of Households by Household Type by Age of Householder: New Jersey and Counties
- Ratio of Income to Poverty in the Past 12 Months: New Jersey, Counties and Municipalities
- Poverty Status by Age in the Past 12 Months: New Jersey, Counties and Municipalities
- Poverty Status by Age and Sex in the Past 12 Months: New Jersey, Counties and Municipalities
- Poverty Status in the Past 12 Months of Households by Household Type by Age of Householder: New Jersey, Counties and Municipalities
For detailed information on appropriate data usage and ACS methodology, please consult the General Data Users Handbook, also published by the US Census Bureau.
Annual Personal Income
State Personal Income
- Per capita personal income for the U.S. and the 50 states
- Total personal income for the U.S. and the 50 states
- Total disposable personal income by state
- Per capita disposable personal income by state
- Per Capita and Personal Income for 1969 - 2024
Note: Click here for definitions related to BEA regional personal income data. Click here for methodologies related to BEA regional economic accounts, including personal income.
Quarterly Personal Income
- Quarterly Personal Income by State & Region, IQ23-IQ25:
- Quarterly Personal Income by State & Region, 1969 - 2025:
- Quarterly Personal Income & Earnings by Industry - New Jersey:
- IQ98-IQ25: Excel
- State Per Capita and Personal Income, News Release (Bureau of Economic Analysis)
Personal Income
- Personal Income by Metropolitan Area, 2021-2023 (Excel)
- Per Capita Personal Income by Metropolitan Area, 2021-2023 (Excel)
- Metropolitan and Micropolitan Statistical Areas (Current list and definitions US Census Bureau's site)
Local Area Personal Income News Release (Bureau of Economic Analysis, November 2021)
The Bureau of Economic Analysis (BEA) of the Department of Commerce publishes annual data on aggregate and per-capita personal income received by the population for State, metropolitan areas, and selected counties. Aggregate income estimates based on the income statistics shown in census products usually would be less than those shown in the BEA income series for several reasons. The Census Bureau data are obtained directly from households, whereas the BEA income series is estimated largely on the basis of data from administrative records of business and governmental sources. Moreover, the definitions of income are different. The BEA income series includes some items not included in the income data shown in census publications, such as income "in kind", income received by nonprofit institutions, the value of services of banks and other financial intermediaries rendered to persons without the assessment of specific charges, Medicare payments, and the income of persons who died or emigrated prior to April 1, 1990. On the other hand, the census income data include contributions for support received from persons not residing in the same household and employer contributions for social insurance.
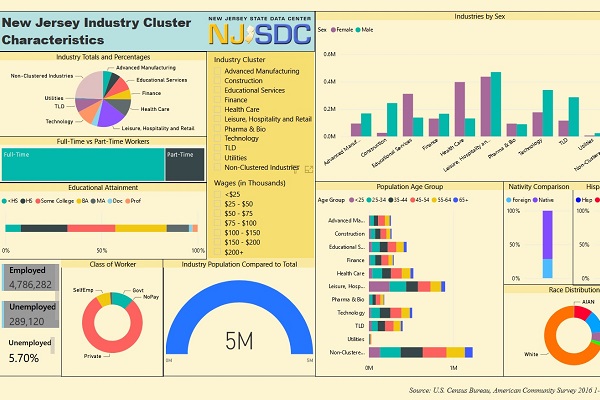
The Power BI Dashboard provides interactive data on New Jersey industry clusters.
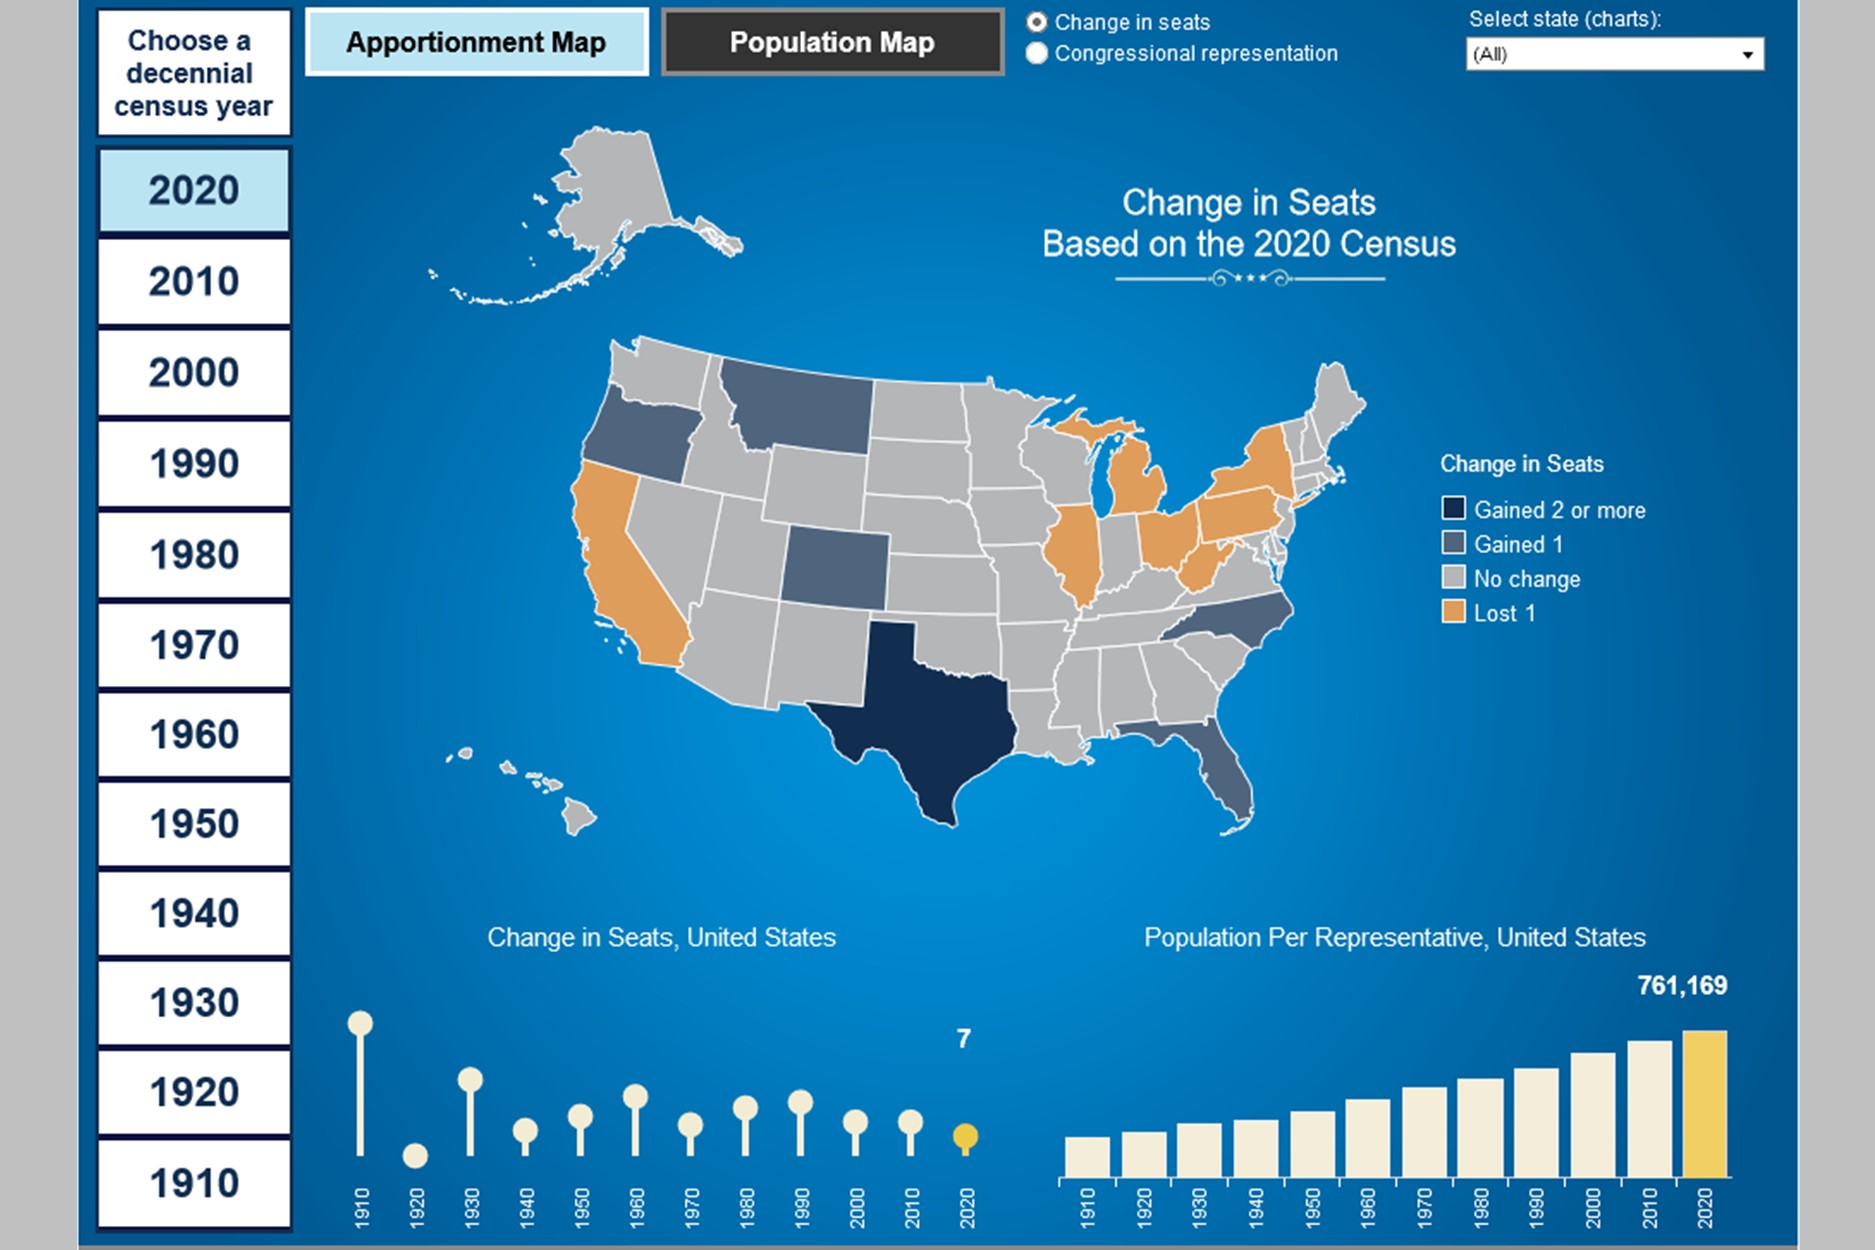
Use this interactive tool to view more than 10 decades of apportionment and population data.
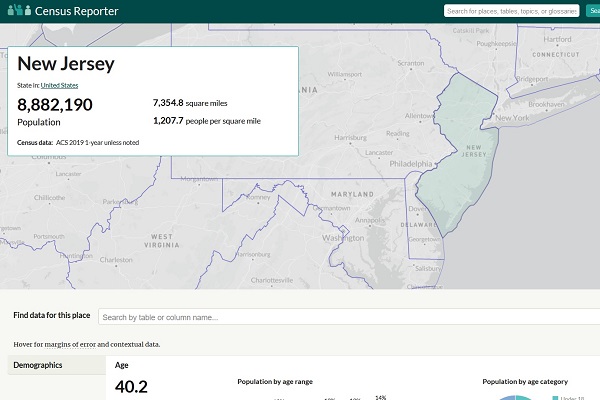
Explore the latest American Community Survey (ACS) data with this interactive tool.