 Official Site of The State of New Jersey
Current Nonfarm Employment Statistics

This page contains estimates of nonfarm wage and salary employment data by major industry classification for New Jersey labor areas for the current year and prior years. These estimates are produced by the New Jersey Department of Labor and Workforce Development. Comparable labor force data for the United States can be obtained from the US Bureau of Labor Statistics.
Note: beginning with the release of 2003 data, the program switched from the Standard Industrial Classification System (SIC) to the 2002 version of the North American Industry Classification System (NAICS) as the basis for the assignment and tabulation of economic data by industry. Please see technical note for further details.
Monthly
- New Jersey Nonagricultural Wage & Salary Employment: 2020 to 2025 (Seasonally Adjusted)
- New Jersey Nonagricultural Wage & Salary Employment: 2020 to 2025 (Not Seasonally Adjusted)
- New Jersey Nonagricultural Wage & Salary Employment: 2010 to 2019 (Seasonally Adjusted)
- New Jersey Nonagricultural Wage & Salary Employment: 2010 to 2019 (Not Seasonally Adjusted)
- New Jersey Nonagricultural Wage & Salary Employment: 2000 to 2009 (Seasonally Adjusted)
- New Jersey Nonagricultural Wage & Salary Employment: 2000 to 2009 (Not Seasonally Adjusted)
- New Jersey Nonagricultural Wage & Salary Employment: 1990 to 1999 (Seasonally Adjusted)
- New Jersey Nonagricultural Wage & Salary Employment: 1990 to 1999 (Not Seasonally Adjusted)
- New Jersey Nonagricultural Employment, Hours and Earnings: 2001 to 2025
All Years
- New Jersey Nonagricultural Wage & Salary Employment: 1990 to 2025 (Seasonally Adjusted)
- New Jersey Nonagricultural Wage & Salary Employment: 1990 to 2025 (Not Seasonally Adjusted)
Annual
New Jersey Labor Area Nonfarm Payroll Employment
|
1990s |
2000s |
2010s |
2020s |
All Years |
|
|
Atlantic City-Hammonton |
|||||
|
Bergen-Hudson-Passaic |
|||||
|
Camden |
Excel | ||||
| Lakewood–New Brunswick | |||||
| Newark | |||||
| Trenton-Princeton | |||||
| Vineland |
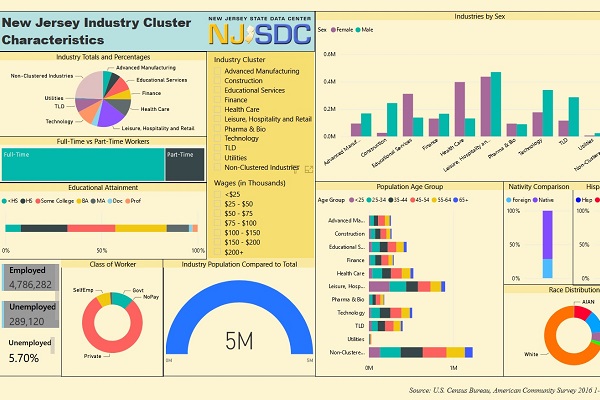
The Power BI Dashboard provides interactive data on New Jersey industry clusters.
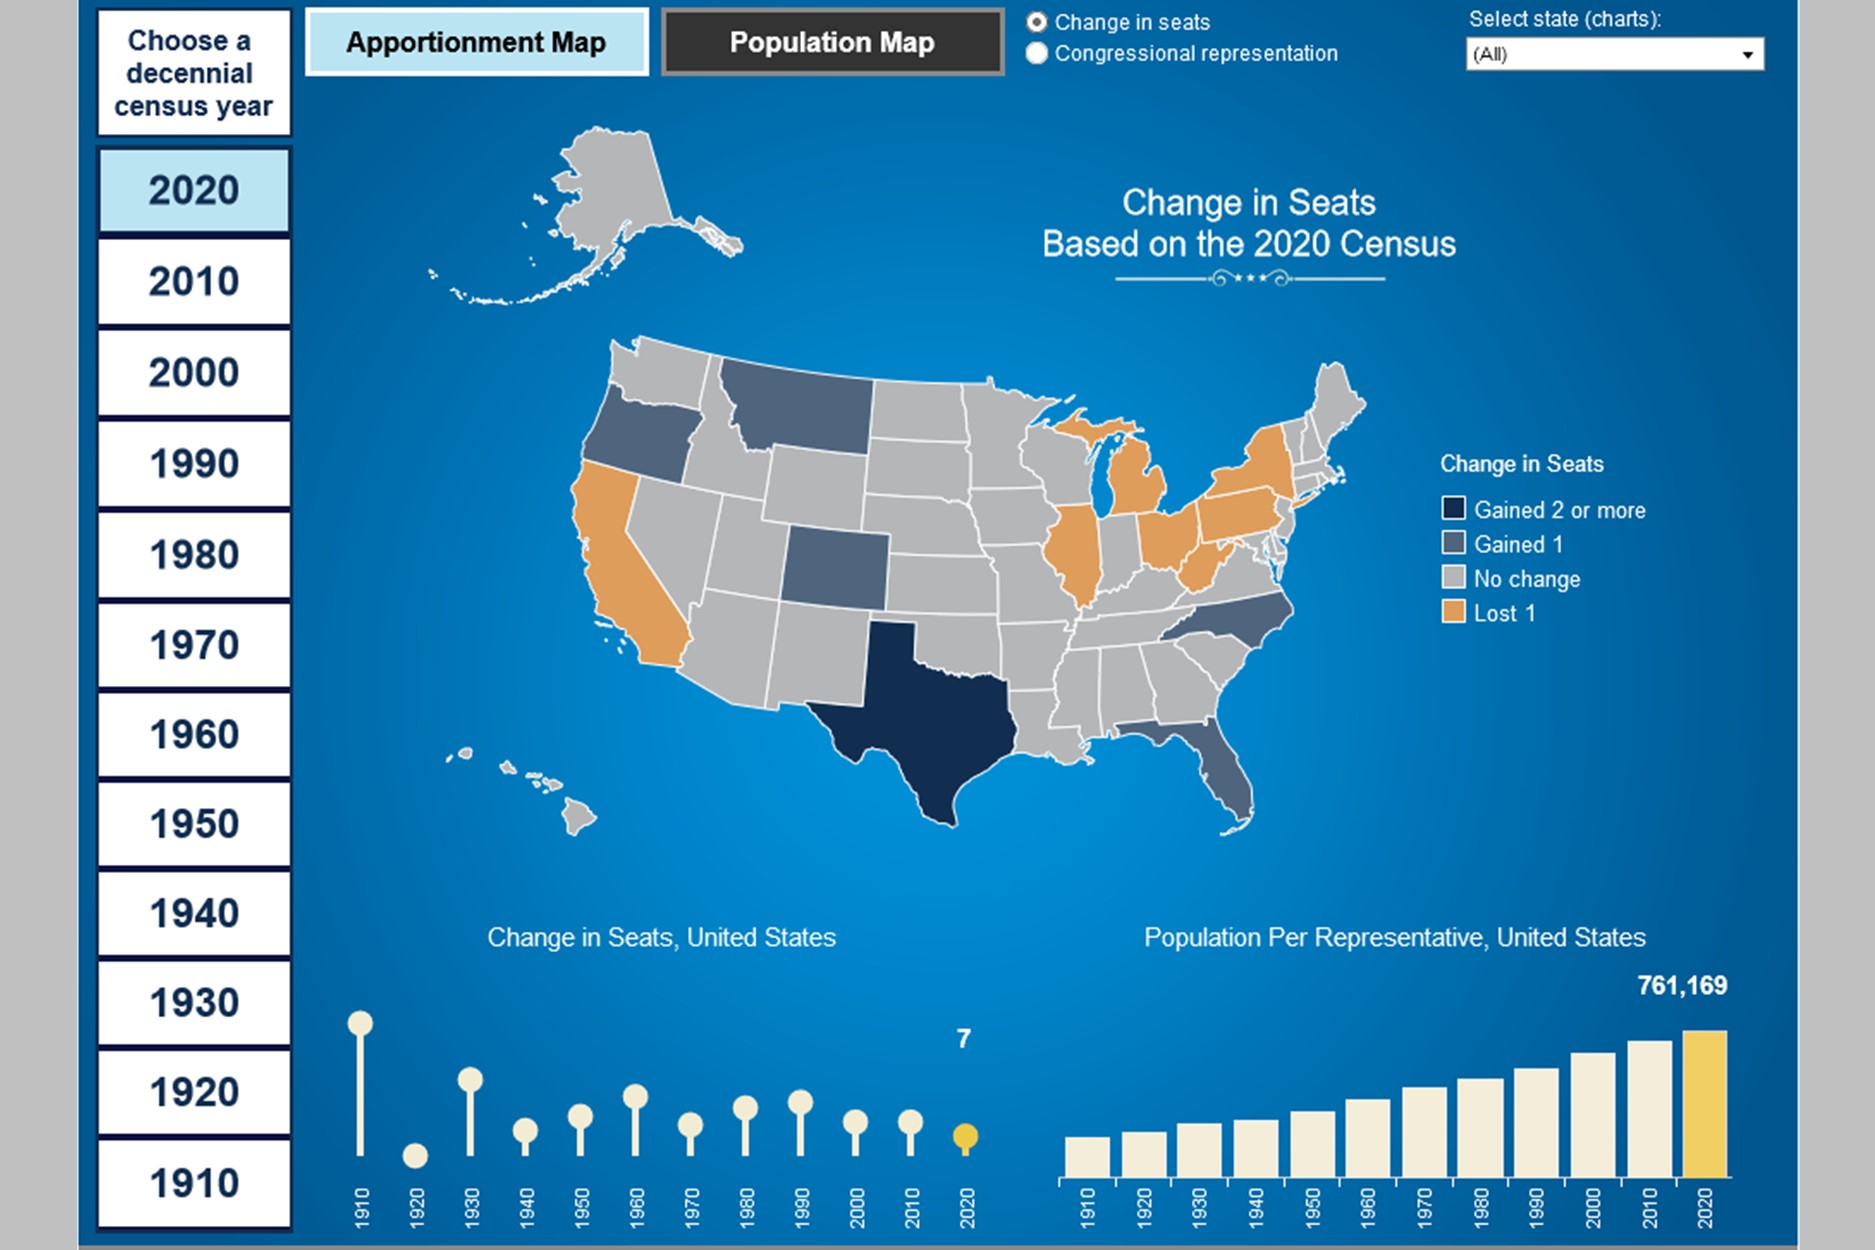
Use this interactive tool to view more than 10 decades of apportionment and population data.
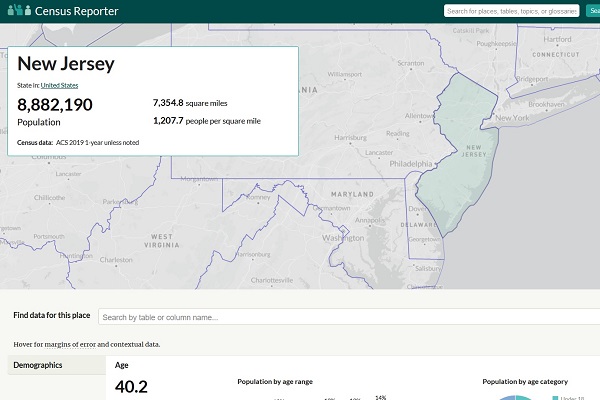
Explore the latest American Community Survey (ACS) data with this interactive tool.