 Official Site of The State of New Jersey
Population and Household Estimates

This page contains intercensal population estimates data for New Jersey. Data are provided for the state, metropolitan areas, counties and municipalities. Population estimates are updated annually. In the process of preparing current year estimates, previous years' data (since the latest decennial census) were also revised. The current estimates supersede previously published estimates.
The U.S. Census Bureau's Population Estimates Program (PEP) produces estimates of the population of the United States, its states, counties, cities, and towns, as well as for the Commonwealth of Puerto Rico and its municipios. Demographic components of population change (births, deaths and migration) are produced at the national, state and county levels of geography.
Median Age and Age by Sex:
- Annual Estimates of the Resident Population for Selected Age Groups by Sex for the United States: April 1, 2020 to July 1, 2025
- Annual Estimates of the Resident Population by Single Year of Age and Sex for the United States: April 1, 2020 to July 1, 2025
Sex, Race, and Hispanic Origin:
- Annual Estimates of the Resident Population by Sex, Race, and Hispanic Origin for the United States: April 1, 2020 to July 1, 2025
- Estimates of the Components of Resident Population Change by Race and Hispanic Origin for the United States: April 1, 2020 to July 1, 2025
Median Age and Age by Sex, Race, and Hispanic Origin:
Population Estimates: United States and States (EXCEL)
- Annual Estimates of the Population: April 1, 2020 to July 1, 2025
- Annual and Cumulative Estimates of Resident Population Change: April 1, 2020 to July 1, 2025
- Annual and Cumulative Estimates of the Components of Change: April 1, 2020 to July 1, 2025
- All Tables in EXCEL
National Population Growth Maps 2025:
- US Population Growth 2024 – 2025
- Northeast Population Growth 2024 – 2025
- US Population Growth 2020 – 2025
- Northeast Population Growth 2020 – 2025
New Jersey Population by Age, Race, Sex and Hispanic Origin:
- Annual Estimates of the Resident Population for Selected Age Groups by Sex: April 1, 2020 to July 1, 2025
- Annual Estimates of the Resident Population by Single Year of Age and Sex: April 1, 2020 to July 1, 2025
- Annual Estimates of the Resident Population by Sex, Race, and Hispanic Origin: April 1, 2020 to July 1, 2025
- Population Estimates by Age, Race Alone, Sex and Hispanic Origin: April 1, 2020 to July 1, 2025
- Population Estimates by Age, Race Alone or in Combination, Sex and Hispanic Origin: April 1, 2020 to July 1, 2025
2010-2020
- Methodology for the Intercensal Population and Housing Unit Estimates: 2010 to 2020
- Intercensal Estimates of Resident Population by State: April 1, 2010 to July 1, 2020
2000-2010
- Methodology for the Intercensal Population and Housing Unit Estimates: 2000 to 2010 (Revised October 2012)
- Intercensal Estimates of Resident Population by State: April 1, 2000 to July 1, 2010
- Intercensal Estimates of Resident Population by Age and Race for New Jersey: April 1, 2000 to July 1, 2010
- Intercensal Estimates of Resident Population by Race, Sex and Hispanic Origin for New Jersey: April 1, 2000 to July 1, 2010
- Intercensal Estimates of Resident Population by Age, Race, Sex and Hispanic Origin for New Jersey: April 1, 2000 to July 1, 2010
Pre-2000
- Intercensal Population Estimates: New Jersey 1970 - 2000
- The Intercensal Population Estimates for New Jersey by Age, Race, Sex and Hispanic Origin: 1990 to 1999
- Intercensal Population Estimates for New Jersey by Age, Race, Sex and Hispanic Origin: 1981 to 1989 (This is an archive of data and document files. PKUNZIP 2.04 or newer is required to un compress it. Make sure the file has a ".ZIP" extension.)
For more info, visit US Census Bureau's Intercensal Estimates web page.
Historical Estimates - Age, Race and Sex:
- New Jersey Population Estimates by Selected Age Groups and Sex: April 1, 2000 to July 1, 2009
- New Jersey Population Estimates by Single-Year of Age and Sex: April 1, 2000 to July 1, 2009
- New Jersey Population Estimates by Sex, Race and Hispanic Origin: April 1, 2000 to July 1, 2009
- New Jersey Population Estimates by Age, Race, Sex and Hispanic Origin: April 1, 2000 to July 1, 2009
- Estimates of Resident Population by Age & Sex, NJ: 1990-1999
- Estimates of Resident Population by Age, Race, Sex and Hispanic Origin, New Jersey: 1990-1999
- Estimates of New Jersey Population by Single-Years of Age, Race, Sex & Hispanic Origin: 1990-1999
Historical Estimates - Total Population:
- Population Estimates Methodology
- US. Census Bureau Population Topics
- Boundary Changes: government unit boundaries are updated annually. Population estimates generally include geographic updates submitted by April 1 of each estimate year.
- How does your state compare? Population Change for States (and Puerto Rico) from July 2020 to July 2021
- Population Estimates for Selected Metropolitan Areas: 2010-2019
- Population Estimates for Selected Metropolitan Areas: 2000-2009
- Population Estimates for Selected Metropolitan Areas: 1990-1999
- Population Estimates for Selected Metropolitan Areas: 1980-1989
- Population Estimates for Selected Metropolitan Areas: 1970-1990
County Population Estimates: 2020-2025 (Total Population and Components of Change; Births, Deaths and Net Migration):
- Excel (Total Population and Components of Change; Births, Deaths and Net Migration)
Population Estimates: New Jersey (EXCEL)
- Annual Estimates of the Population: April 1, 2020 to July 1, 2025
- Annual and Cumulative Estimates of Resident Population Change: April 1,2020 to July 1, 2025
- Annual and Cumulative Estimates of the Components of Change: April 1, 2020 to July 1, 2025
- Highlights from the 2025 County Population Estimates
Maps:
2010-2020
- Methodology for the Intercensal Population and Housing Unit Estimates: 2010 to 2020
- Intercensal Estimates of the Resident Population for Counties of New Jersey: April 1, 2010 to April 1, 2020
2000-2010
- Methodology for the Intercensal Population and Housing Unit Estimates: 2000 to 2010 (Revised October 2012)
- Intercensal Estimates of the Resident Population for Counties of New Jersey: April 1, 2000 to July 1, 2010
- Intercensal Estimates of Population by Age and Sex for Counties in New Jersey: April 1, 2000 to July 1, 2010
- Intercensal Estimates of Population by Race, Sex and Hispanic Origin for Counties in New Jersey: April 1, 2000 to July 1, 2010
- Intercensal Estimates of Population by Age, Race, Sex and Hispanic Origin for Counties in New Jersey: April 1, 2000 to July 1, 2010
Pre-2000
- 2010 Modified Race Data Methodology
- Population by Race, Sex and Hispanic Origin: Census 2010 Summary File 2 (SF2) and Modified Race Data
- Population by Race, Sex and Hispanic Origin: Census 2000 Summary File 2 (SF2) and Modified Age-Race-Sex (MARS) Data
- Census 2000 Modified Race Data Summary File Technical Documentation
Age, Race, Sex and Hispanic Origin:
- County Population Estimates by Race, Sex and Hispanic Origin: 1990 - 1999
- County Population Estimates by Age and Sex: 1990 - 1999
- Estimates of County Population by Age, Race, Sex and Hispanic origin: July 1, 2000 to July 1, 2009
- New Jersey County Population Estimates by Selected Age Categories and Sex: July 1, 2000 to July 1, 2009
- New Jersey County Population Estimates by Race Alone and Hispanic or Latino Origin: July 1, 2000 to July 1, 2009
- New Jersey County Population Estimates by Race Alone or in Combination and Hispanic or Latino Origin: July 1, 2000 to July 1, 2009
- Documentation for the 1990 - 1999 intercensal estimates
The Intercensal Population Estimates by County by Age, Race, Sex and Hispanic Origin: 1990 to 1999 (This is an archive of data and document files. PKUNZIP 2.04 or newer is required to un compress it. Make sure the file has a ".ZIP" extension.)
Intercensal Population Estimates by County by Age, Race and Sex: 1981 to 1989 (This is an archive of data and document files. PKUNZIP 2.04 or newer is required to un compress it. Make sure the file has a ".ZIP" extension.)
- 1999 New Jersey State and County Population Estimates by Age, Race, Sex and Hispanic Origin
- Estimates of County Population by Race & Hispanic Origin: New Jersey, 1990-1999
- Estimates of County Population by Race, Sex and Hispanic Origin: New Jersey, 1990-1999
- Estimates of County Population by Age Group: New Jersey, 1990-1999
- Estimates of County Population by Single-Years of Age & Sex: New Jersey, 1990-1999
- County Population Estimates and Components of Change: New Jersey, 1990-1999
- Estimates of population for New Jersey counties by of age, sex, race, and Hispanic origin: 1990-1999 (This is an archive of data and document files. PKUNZIP 2.04 or newer is required to un compress it. Make sure the file has a ".ZIP" extension.)
Modified Age-Race-Sex (MARS) Data by County:
- Intercensal population estimates by municipality: 2010-2020
- Intercensal population estimates by municipality: 2000-2010
- Intercensal population estimates by municipality: 1990-1999
- Excel
- Note: these are revised estimates based on both the original postcensal estimates and the 2000 Census counts.
- Intercensal population estimates by municipality: 1981-1989
- Intercensal population estimates by municipality: 1971-1979
- Description and methodology of the 1970-1990 Intercensal Municipal Estimates
- Intercensal estimates of population for New Jersey plus original population estimates from 1971-1989 (This is an archive of data and document files. PKUNZIP 2.04 or newer is required to un compress it. Make sure the file has a ".ZIP" extension.)
Estimates of Resident Population by Municipality (2010-2019):
- EXCEL
- Note: these estimates were produced before the 2020 Census counts were available. They may not be consistent with the 2020 figures.
Estimates of Resident Population by Municipality (2000-2009):
- Excel
- Note: these estimates were produced before the 2010 Census counts were available. They may not be consistent with the 2010 figures.
Estimates of Resident Population by Municipality (1990-1999):
- Excel
Note: these estimates were produced before the 2000 Census counts were available. They may not be consistent with the 2000 figures.
- Annual Estimates of Housing Units for Counties in New Jersey: April 1, 2010 to July 1, 2020
- Annual Estimates of Housing Units for the United States and States: 2010 to 2020
- Housing Unit Estimates for the nation's 50 states: 2000 to 2009
- Annual Estimates of Housing Units for New Jersey: 2000 to 2009
- New Jersey Households, Persons per Household, Households by Age of Householder and Total Housing Units: 1990-1998
This section contains state-to-state and county-to-county migration files provided by the Internal Revenue Service (IRS) Statistics of Income (SOI) Division. The migration data are available for inflows (the number of new residents who moved to a State or county and where they migrated from) and outflows (the number of residents leaving a State or county and where they went). Migration data are based on the population of Forms 1040 that were filed and processed by the IRS. Tax returns are matched for two consecutive calendar years based on the filer’s taxpayer identification number (TIN) to determine their migration status.
Annual State-to-State Inflows and Outflows: New Jersey, 2000-2019
County-to-County Migration Flows: New Jersey Counties, 2000-2019:
- Atlantic County
- Bergen County
- Burlington County
- Camden County
- Cape May County
- Cumberland County
- Essex County
- Gloucester County
- Hudson County
- Hunterdon County
- Mercer County
- Middlesex County
- Monmouth County
- Morris County
- Ocean County
- Passaic County
- Salem County
- Somerset County
- Sussex County
- Union County
- Warren County
More IRS Migration data are available on the SOI web page.
The State-to-State migration flows is part of a product series the Census releases yearly. The State-to-State migration flows utilize ACS (American Community Survey) and PRCS (Puerto Rico Community Survey) and ask respondents if they live in the same residence they did a year ago. For respondents who have moved the previous residence is collected, and the results are created from a cross tabulation of where they currently live from their previous residence the year before. More information can be found on the Census’s website: (https://www.census.gov/topics/population/migration/guidance/state-to-state-migration-flows.html).
The rows in each table represent the state of current residence and the columns represent the state of residence 1 year ago. The cells where the current residence and residence 1 year ago are the same are the estimated number of people who moved within the state.
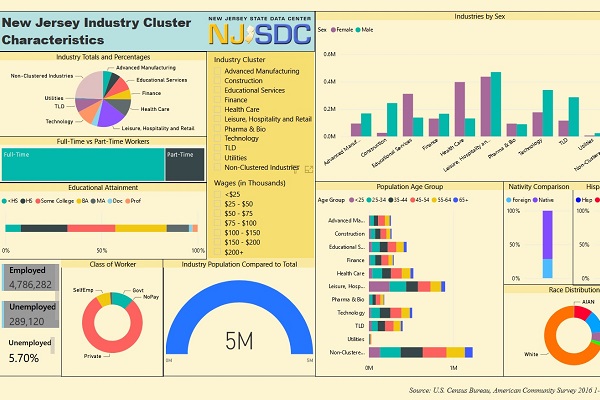
The Power BI Dashboard provides interactive data on New Jersey industry clusters.
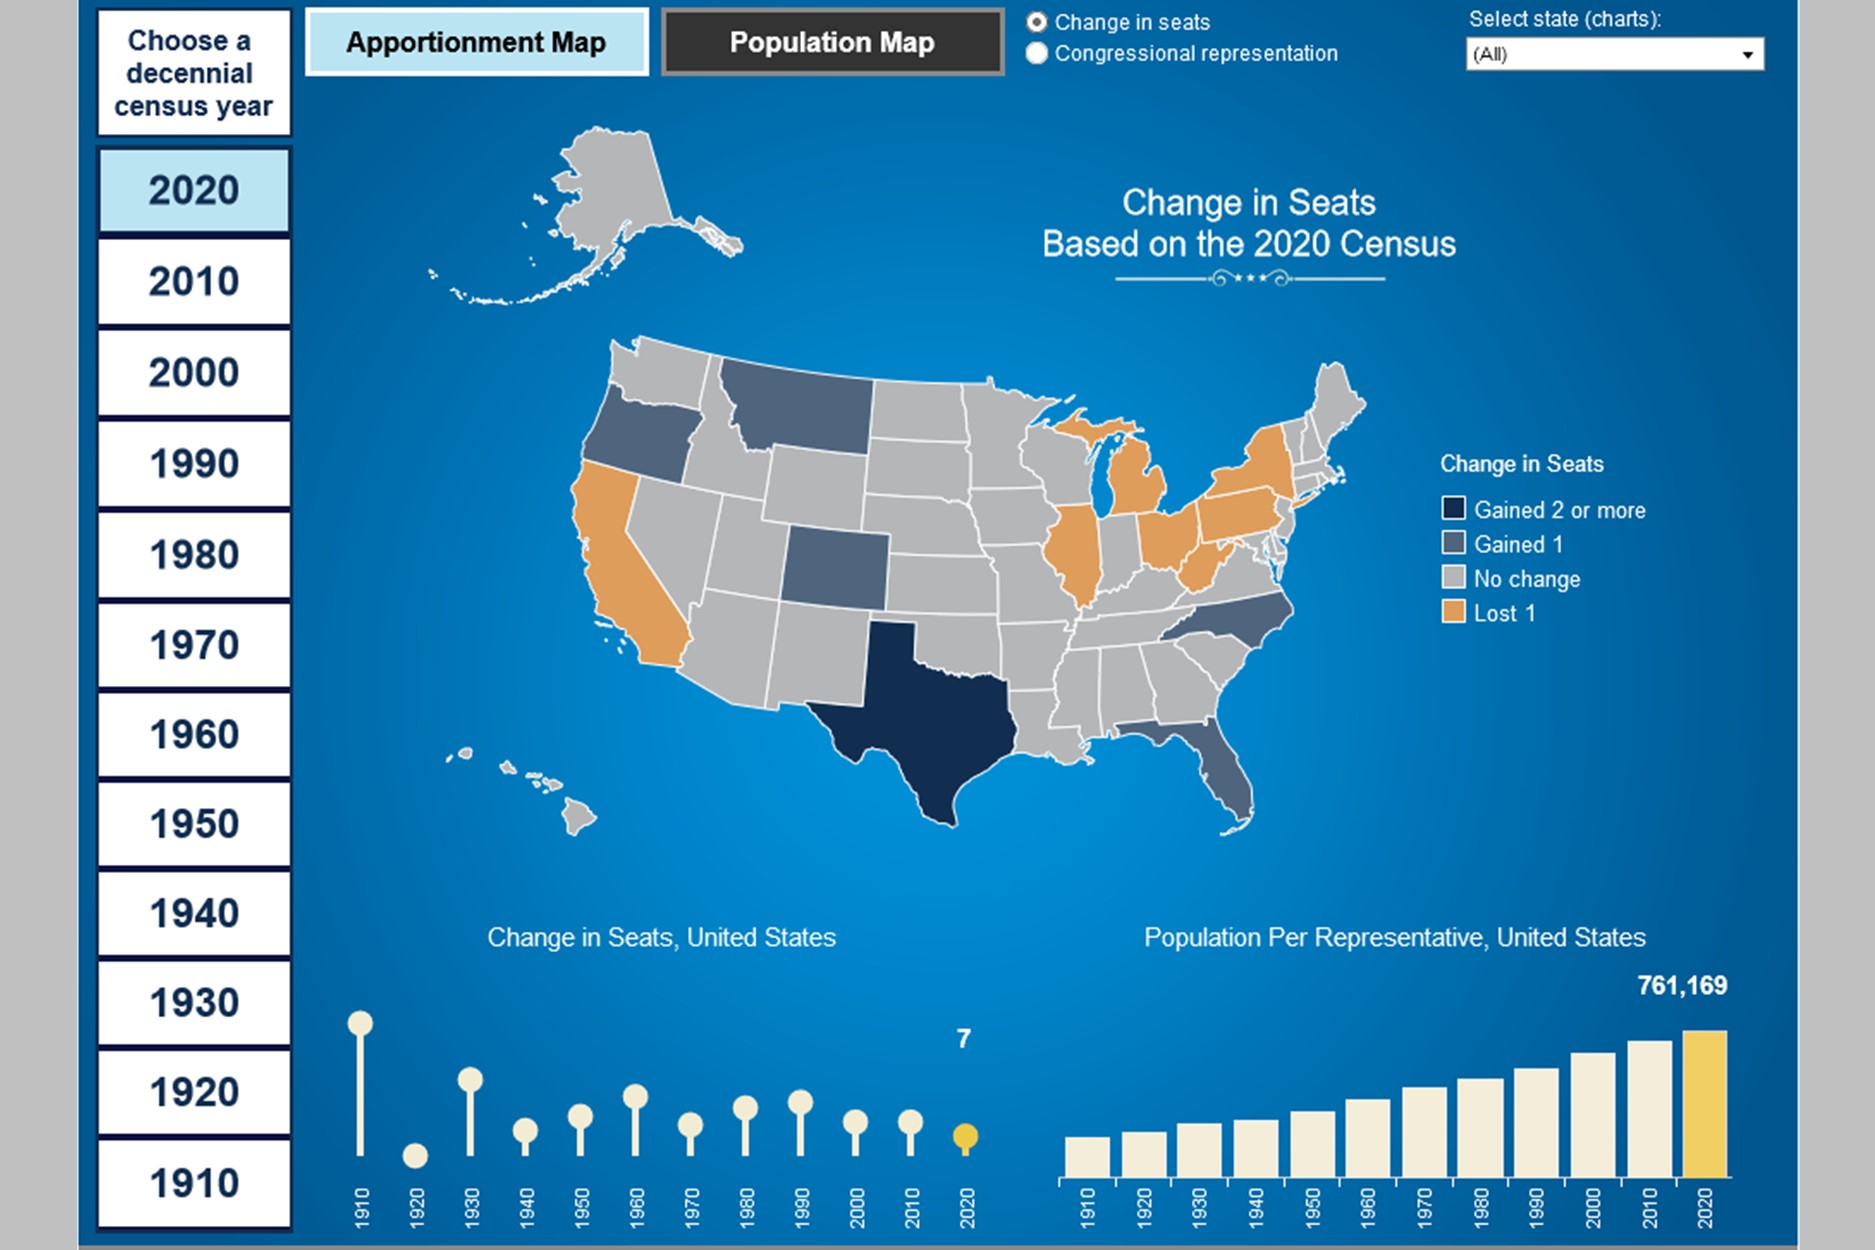
Use this interactive tool to view more than 10 decades of apportionment and population data.
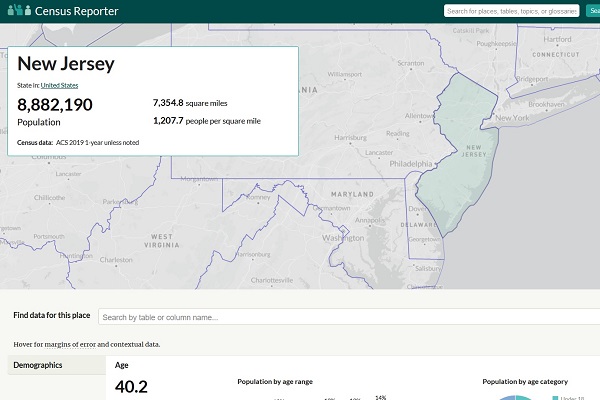
Explore the latest American Community Survey (ACS) data with this interactive tool.