 Official Site of The State of New Jersey
2010 Census Data

The population of New Jersey on April 1, 2010 was 8,791,894.
This page contains Census 2010 information from the US Census Bureau for New Jersey.
The 100-Percent File contains data collected for all people and housing units, as reflected by the Census 2010 short-form questionnaire covers the same basic subject characteristics as Summary File 1. Data for all states, District of Columbia, and Puerto Rico are available form the US Census Bureau's web site. Geographic areas include, but are not limited to, the following entities with congressional districts: county; county subdivision; place, state portion of American Indian and Alaska Native area(with trust lands and with no trustlands) and Hawaiian home land.
|
Demographic Profile: Data from the 100-Percent count |
||
|
The profile provides the demographic and housing characteristics. |
||
|
Congressional District 1 |
||
|
Congressional District 2 |
||
|
Congressional District 3 |
||
|
Congressional District 4 |
||
|
Congressional District 5 |
||
|
Congressional District 6 |
||
|
Congressional District 7 |
||
|
Congressional District 8 |
||
|
Congressional District 9 |
||
|
Congressional District 10 |
||
|
Congressional District 11 |
||
|
Congressional District 12 |
||
|
Congressional District 13 |
||
Summary File 1 (SF-1) tables provide 100-percent data from the decennial census in 57-page profile reports for each level of geography. The profiles provide information on various demographic and housing characteristics for the states, counties, minor civil divisions, places, congressional districts and state legislative districts, metropolitan areas, American Indian and Alaska Native areas, and Hawaiian home lands.
News Releases and Data Highlights
News Release: Census Bureau Releases New Local Level Data from 2010 Census for New Jersey (US Census Bureau)
Summary File 1 Highlights
Selected data characteristics from 2010 SF 1 files for New Jersey and Counties: Excel
State and Counties
Profiles for New Jersey: PDF
Profiles for New Jersey Counties:
Municipalities
For municipality data, click here.
Congressional Districts
|
Congressional District 1 |
|
|
Congressional District 2 |
|
|
Congressional District 3 |
|
|
Congressional District 4 |
|
|
Congressional District 5 |
|
|
Congressional District 6 |
|
|
Congressional District 7 |
|
|
Congressional District 8 |
|
|
Congressional District 9 |
|
|
Congressional District 10 |
|
|
Congressional District 11 |
|
|
Congressional District 12 |
|
|
Congressional District 13 |
State Legislative Districts
|
State Legislative District 1 |
State Legislative District 21 |
||
|
State Legislative District 2 |
State Legislative District 22 |
||
|
State Legislative District 3 |
State Legislative District 23 |
||
|
State Legislative District 4 |
State Legislative District 24 |
||
|
State Legislative District 5 |
State Legislative District 25 |
||
|
State Legislative District 6 |
State Legislative District 26 |
||
|
State Legislative District 7 |
State Legislative District 27 |
||
|
State Legislative District 8 |
State Legislative District 28 |
||
|
State Legislative District 9 |
State Legislative District 29 |
||
|
State Legislative District 10 |
State Legislative District 30 |
||
|
State Legislative District 11 |
State Legislative District 31 |
||
|
State Legislative District 12 |
State Legislative District 32 |
||
|
State Legislative District 13 |
State Legislative District 33 |
||
|
State Legislative District 14 |
State Legislative District 34 |
||
|
State Legislative District 15 |
State Legislative District 35 |
||
|
State Legislative District 16 |
State Legislative District 36 |
||
|
State Legislative District 17 |
State Legislative District 37 |
||
|
State Legislative District 18 |
State Legislative District 38 |
||
|
State Legislative District 19 |
State Legislative District 39 |
||
|
State Legislative District 20 |
State Legislative District 40 |
Summary File 2 (SF-2) tables provide 100-percent data from the decennial census in ten-section reports for each level of geography. The profiles provide the most detail to date on various demographic and housing characteristics for the states, counties, minor civil divisions, places, congressional districts and state legislative districts, metropolitan areas, American Indian and Alaska Native areas, and Hawaiian home lands.
Click here for Technical Documentation for Summary File 2.
State and Counties
- Profiles for New Jersey: PDF
- Profiles for New Jersey Congressional Districts: PDF
- Profiles for New Jersey State Legislative Districts:
Counties and Municipalities Within Each County:
- Atlantic County: PDF
- Bergen County 1: (Total Population, White, White, Not Hispanic): PDF
- Bergen County 2: (Black, American Indian/Alaska Native, Asian, Native Hawaiian/Pacific Islander, Some Other Race): PDF
- Bergen County 3: (Two or More Races, Hispanic, Not Hispanic): PDF
- Burlington County 1: (Total Population, White, Black, American Indian/Alaska
Native, Asian, Native Hawaiian/Pacific Islander): PDF - Burlington County 2: (Some Other Race, Two or More Races, Hispanic,
Not Hispanic, White Not Hispanic): PDF - Camden County 1: (Total Population, White, Black, American Indian/Alaska
Native, Asian, Native Hawaiian/Pacific Islander): PDF - Camden County 2: (Some Other Race, Two or More Races, Hispanic,
Not Hispanic, White Not Hispanic): PDF - Cape May County: PDF
- Cumberland County: PDF
- Essex County: PDF
- Hudson County: PDF
- Hunterdon County: PDF
- Mercer County: PDF
- Middlesex County: PDF
- Monmouth County 1: (Total Population, White, Black, American Indian/Alaska Native, Asian, Native Hawaiian/Pacific Islander): PDF
- Monmouth County 2: (Some Other Race, Two or More Races, Hispanic, Not Hispanic, White Not Hispanic): PDF
- Morris County 1: (Total Population, White, Black, American Indian/Alaska Native, Asian, Native Hawaiian/Pacific Islander): PDF
- Morris County 2: (Some Other Race, Two or More Races, Hispanic, Not Hispanic, White Not Hispanic): PDF
- Ocean County 1: (Total Population, White, Black, American Indian/Alaska Native, Asian, Native Hawaiian/Pacific Islander): PDF
- Ocean County 2: (Some Other Race, Two or More Races, Hispanic, Not Hispanic, White Not Hispanic): PDF
- Passaic County: PDF
- Salem County: PDF
- Somerset County: PDF
- Sussex County: PDF
- Union County: PDF
- Warren County: PDF
A profile table that provides the demographic and housing characteristics for the states, counties, minor civil divisions in selected states, places, metropolitan areas, American Indian and Alaska Native areas, Hawaiian home lands and congressional districts. It includes 100-percent data from the decennial censuses.
News Releases and Data Highlights
News Release: Census Bureau Delivers New Jersey's Census 2010 Demographic Profiles. (Released on 5/26/11) (US Census Bureau Press Release)
Data Highlights:
Profiles for New Jersey
Profiles for New Jersey Counties
|
Atlantic County |
Gloucester County |
Ocean County |
||||||
|
Bergen County |
Hudson County |
Passaic County |
||||||
|
Burlington County |
Hunterdon County |
Salem County |
||||||
|
Camden County |
Mercer County |
Somerset County |
||||||
|
Cape May County |
Middlesex County |
Sussex County |
||||||
|
Cumberland County |
Monmouth County |
Union County |
||||||
|
Essex County |
Morris County |
Warren County |
Municipalities and Census Designated Places (CDPs)
Click here to view Municipalities & Census Designated Places (CDPs)
Metropolitan Statistical Areas (PMSAs)
|
Allentown-Bethlehem-Easton, PA-NJ (MSA) |
|
|
Atlantic City-Hammonton, NJ (MSA) |
|
|
New York-Northern New Jersey-Long Island, NY-NJ-PA (MSA) |
|
|
Ocean City, NJ (MSA) |
|
|
Philadelphia-Camden-Wilmington, PA-NJ-DE-MD (MSA) |
|
|
Trenton-Ewing, NJ (MSA) |
|
|
Vineland-Millville-Bridgeton, NJ (MSA) |
|
|
Camden, NJ Metropolitan Division |
|
|
Edison-New Brunswick, NJ Metropolitan Division |
|
|
Newark-Union, NJ-PA Metropolitan Division |
|
|
New York-White Plains-Wayne, NY-NJ Metropolitan Division |
|
|
Wilmington, DE-MD-NJ Metropolitan Division |
|
|
New York-Newark-Bridgeport, NY-NJ-CT-PA (CSA) |
|
|
Philadelphia-Camden-Vineland, PA-NJ-DE-MD (CSA) |
Congressional Districts
|
Congressional District 1 |
||
|
Congressional District 2 |
||
|
Congressional District 3 |
||
|
Congressional District 4 |
||
|
Congressional District 5 |
||
|
Congressional District 6 |
||
|
Congressional District 7 |
||
|
Congressional District 8 |
||
|
Congressional District 9 |
||
|
Congressional District 10 |
||
|
Congressional District 11 |
||
|
Congressional District 12 |
||
|
Congressional District 13 |
American Indian Areas
|
Nanticoke Lenni Lenape SDTSA |
|
|
Ramapough SDTSA |
State Legislative Districts
|
State Legislative District 1 |
State Legislative District 21 |
||
|
State Legislative District 2 |
State Legislative District 22 |
||
|
State Legislative District 3 |
State Legislative District 23 |
||
|
State Legislative District 4 |
State Legislative District 24 |
||
|
State Legislative District 5 |
State Legislative District 25 |
||
|
State Legislative District 6 |
State Legislative District 26 |
||
|
State Legislative District 7 |
State Legislative District 27 |
||
|
State Legislative District 8 |
State Legislative District 28 |
||
|
State Legislative District 9 |
State Legislative District 29 |
||
|
State Legislative District 10 |
State Legislative District 30 |
||
|
State Legislative District 11 |
State Legislative District 31 |
||
|
State Legislative District 12 |
State Legislative District 32 |
||
|
State Legislative District 13 |
State Legislative District 33 |
||
|
State Legislative District 14 |
State Legislative District 34 |
||
|
State Legislative District 15 |
State Legislative District 35 |
||
|
State Legislative District 16 |
State Legislative District 36 |
||
|
State Legislative District 17 |
State Legislative District 37 |
||
|
State Legislative District 18 |
State Legislative District 38 |
||
|
State Legislative District 19 |
State Legislative District 39 |
||
|
State Legislative District 20 |
State Legislative District 40 |
Census Bureau Delivers New Jersey's Census 2010 Population Totals for Congressional Redistricting (Released on 2/3/11) (US Census Bureau Press Release)
|
Table 1. The Counties and Most Populous Cities and Townships in 2010 in New Jersey: 2000 and 2010 |
|
|
Table 2. Population by Race and Hispanic or Latino Origin, for All Ages and for 18 Years and Over, for New Jersey: 2000 and 2010 |
|
|
Table 3. Population by Race Alone or in Combination and Hispanic or Latino Origin, for All Ages and for 18 Years and Over, for New Jersey: 2000 and 2010 |
|
|
Table 4. Population by Race, Including All Specific Combinations of Two Races, for New Jersey: 2010 |
|
|
Table 5. The Counties and Most Populous Cities and Townships by Race and Hispanic or Latino Origin in New Jersey: 2010 |
|
|
Download tables 1 through 5 in one file |
|
|
Population Density by County: 2000 & 2010 |
|
|
Population Density by Municipality: 2000 & 2010 |
|
|
Minorities Population in Municipalities: 2010 |
|
|
Advance Group Quarters Data: 2010 |
|
Advance Group Quarters Data:
County and Municipal population highlights table:
Population by Race and Hispanic or Latino Origin:
Population by Race and Hispanic or Latino Origin, for New Jersey Counties: 2000 and 2010
Population by Race and Hispanic or Latino Origin for New Jersey Counties (2000 and 2010):
|
Population by race, all ages (excel) |
|
|
Note: Individual Race Alone table percentages stated as a percentage of Total Population. 2000 Census counts as published in 2000 census reports and thus do not include changes published subsequently due to boundary changes or to the Count Questionnaire Resolution program. |
|
Population by Race and Hispanic or Latino Origin for New Jersey Counties (2000 and 2010):
|
Population by race, all ages (excel) |
|
|
Note: Individual Race Alone table percentages stated as a percentage of One Race Total. 2000 Census counts as published in 2000 census reports and thus do not include changes published subsequently due to boundary changes or to the Count Questionnaire Resolution program. |
|
Population by Race and Hispanic or Latino Origin, Population Over and Under 18 Years of Age for New Jersey Counties: 2000 and 2010.
|
|
|
|
Note: 2000 Census counts as published in 2000 census reports and thus do not include changes published subsequently due to boundary changes or to the Count Questionnaire Resolution program. |
|
Advance Group Quarters Data:
Population by Race and Hispanic or Latino Origin, for New Jersey Municipalities
Population for the Counties and Municipalities in New Jersey: 2000 and 2010
Population by Race and Hispanic or Latino Origin for New Jersey Municipalities (2000 and 2010):
|
Note: 2000 Census counts as published in 2000 census reports and thus do not include changes published subsequently due to boundary changes or to the Count Questionnaire Resolution program. |
||
Total Population and Population Over and Under 18 Years of Age for New Jersey Municipalities (2000 and 2010):
|
Note: 2000 Census counts as published in 2000 census reports and thus do not include changes published subsequently due to boundary changes or to the Count Questionnaire Resolution program. |
||
Population by Race and Hispanic or Latino Origin, for All Ages, 18 Years and Over and for 17 and Under, for New Jersey Municipalities:
Population Housing Units and Density:
Population by Race and Hispanic or Latino Origin, New Jersey Congressional & Legislative Districts: 2010
Population by Race and Hispanic or Latino Origin for New Jersey Congressional & Legislative Districts (2000 and 2010):
|
Note: 2000 Census counts as published in 2000 census reports and thus do not include changes published subsequently due to boundary changes or to the Count Questionnaire Resolution program. |
||
Total Population and Population Over and Under 18 Years of Age for New Jersey Congressional & Legislative Districts (2000 and 2010):
|
Note: 2000 Census counts as published in 2000 census reports and thus do not include changes published subsequently due to boundary changes or to the Count Questionnaire Resolution program. |
||
Click here to watch a brief video on apportionment.
Click here to view the Historical Apportionment Data Map.
Tables
- Resident Population of the 50 States, the District of Columbia, and Puerto Rico: Census 2010: Excel
- Resident Population of the 50 States, the District of Columbia, and Puerto Rico: April 1, 2010 (Census 2010) and April 1, 2000 (2000 Census) and State Rank as of 2010 and State Rank as of 2000: Excel
- Resident Population of the 50 States, the District of Columbia, and Puerto Rico: April 1, 2010 (Census 2010) and April 1, 2000 (2000 Census) and Numeric and Percent Change for 2000 to 2010: Excel
- Resident Population for New Jersey, Northeast and US, 1790 to 2010: Excel
- Resident Population for States: 1930 to 2010: Excel
- Resident Population and Population Density by State: 2000 and 2010: Excel
- Resident Population for New Jersey Counties: 2000 and 2010 and number and percent chnge: 2000 to 2010: Excel
- Resident Population for New Jersey Municipalities: 2000 and 2010: and number and percent change 2000-2010: Excel
Maps
New Jersey Population Trend (1790 - 2010)
|
United States Resident Population by State: 1790 - 1840 |
|
|
Percent Distribution of the Population: 1790 - 2010 |
|
|
Decennial Rates of Change in Population: 1790 to 2010 |
|
|
New Jersey Resident Population by County: 1790 - 1860 |
|
|
New Jersey Resident Population by Municipality: 1910 - 2010 |
|
|
New Jersey Population Trend, all tables |
Click here to read Economic Indicator article on New Jersey Population: 1790-2010 (12/2010)
Historical Census Charts for New Jersey
- Participation Rate Municipalities
- Participation Percent Rate Municipalities
- Mail participation levels:
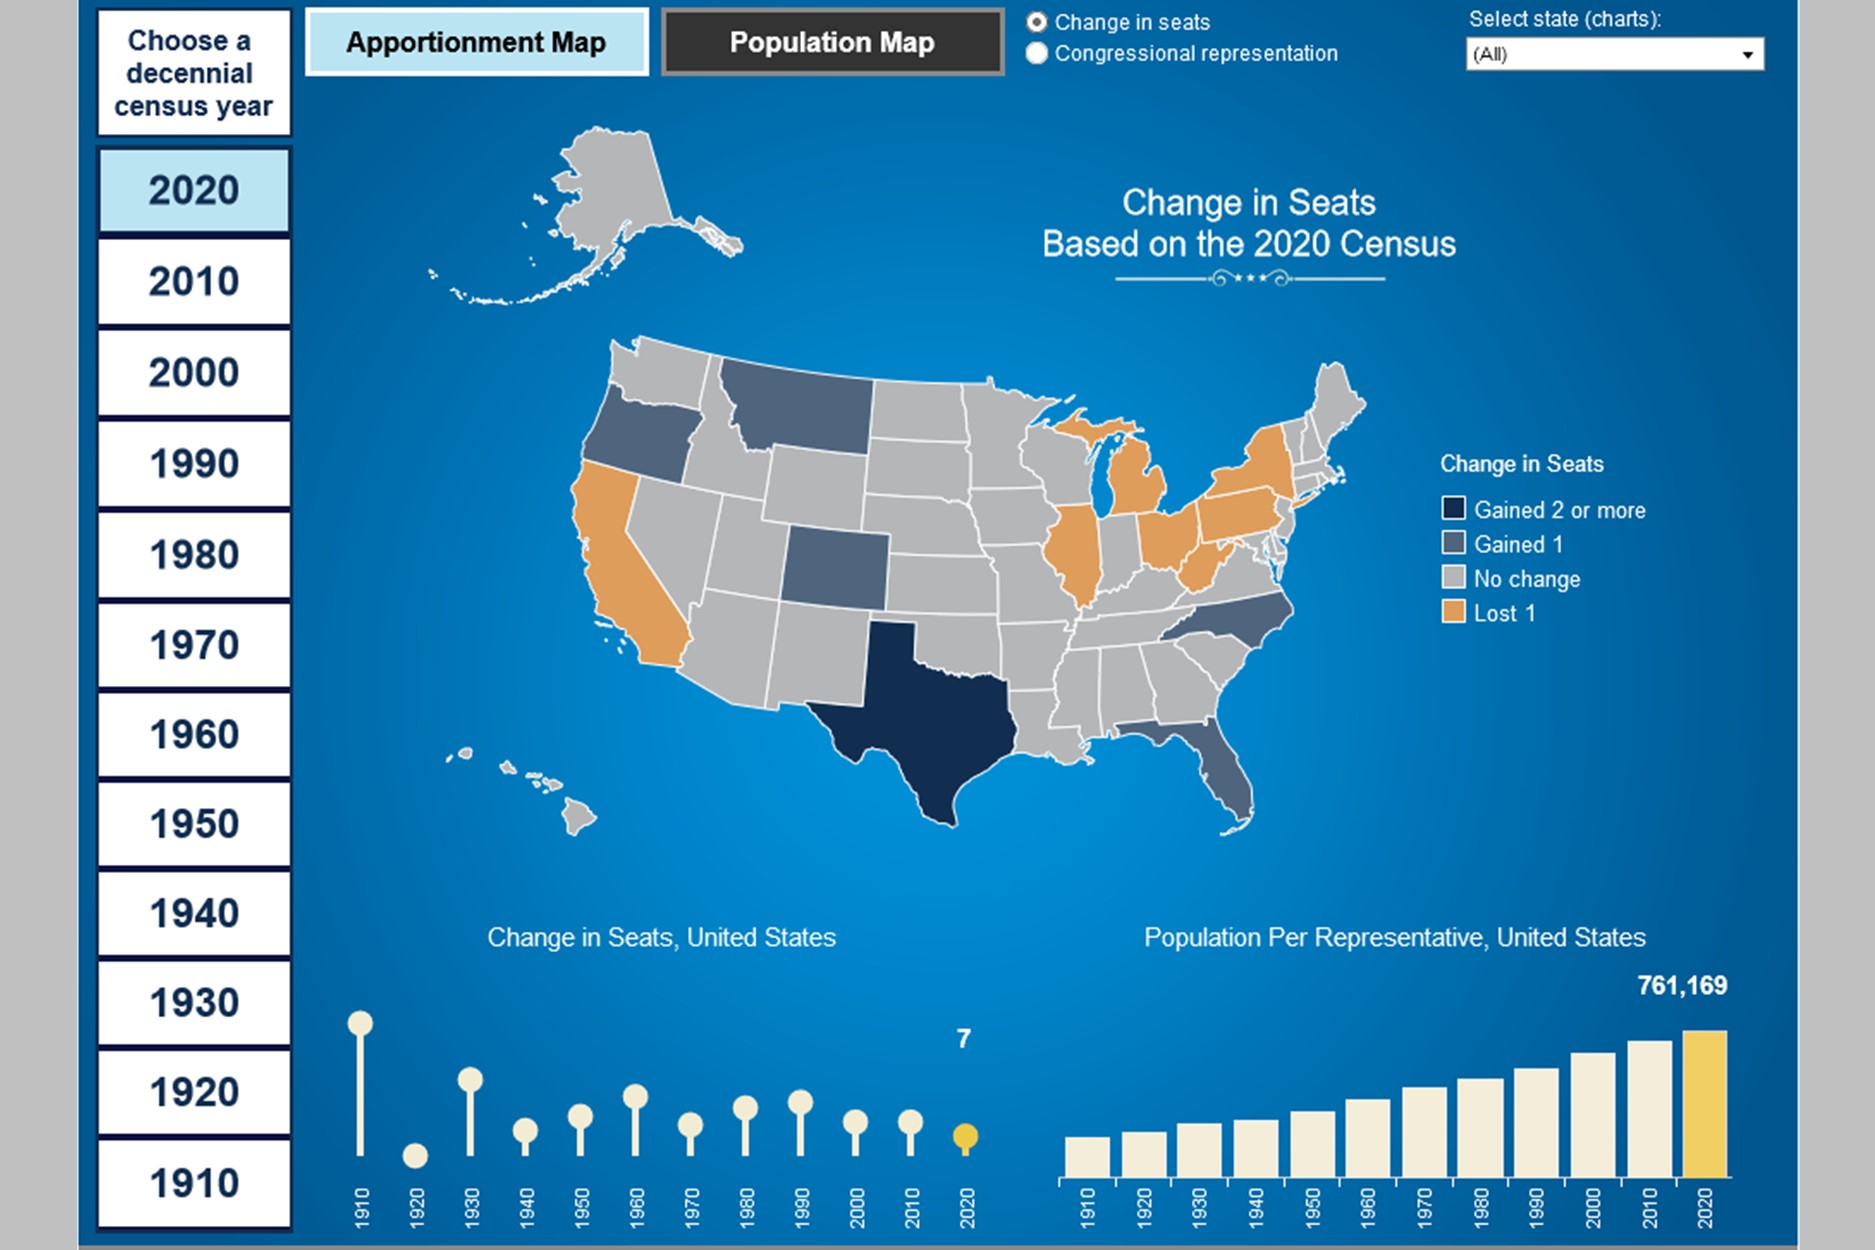
Use this interactive tool to view more than 10 decades of apportionment and population data.
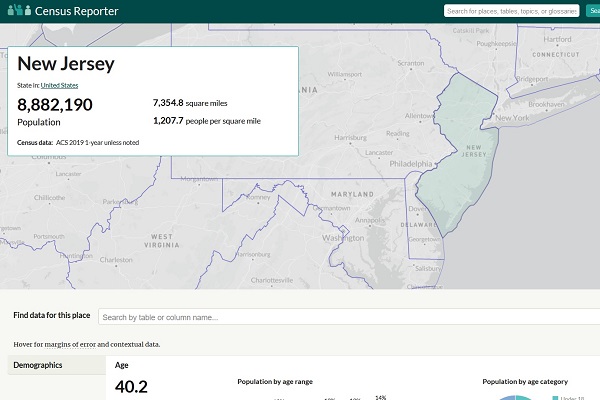
Explore the latest American Community Survey (ACS) data with this interactive tool.